



The U.S. Bureau of Labor Statistics released state employment and unemployment summaries for April.
Unemployment rates were lower in April in 3 states, higher in 2 states, and stable in 45 states and the District of Columbia, the U.S. Bureau of Labor Statistics reported. Nineteen states had jobless rate increases from a year earlier, 6 states had decreases, and 25 states and the District had little change. The national unemployment rate, 4.3 percent, was unchanged over the month and was little changed from April 2025.
In April 2026, nonfarm payroll employment increased in 6 states and was essentially unchanged in 44 states and the District of Columbia. Over the year, nonfarm payroll employment decreased in 1 state and the District, increased in 1 state, and was essentially unchanged in 48 states.
This news release presents statistics from two monthly programs. The civilian labor force and unemployment data are modeled based largely on a survey of households. These data pertain to people by where they reside. The employment data are from an establishment survey that measures nonfarm employment, hours, and earnings by industry. These data pertain to jobs on payrolls defined by where the establishments are located. For more information about the
concepts and statistical methodologies used by these two programs, see the Technical Note.
Unemployment
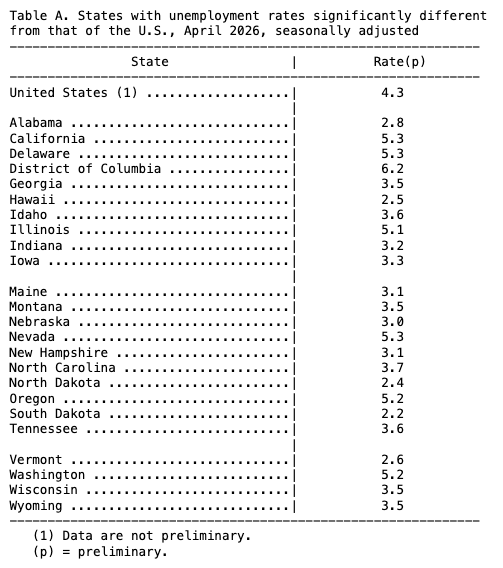
South Dakota had the lowest jobless rate in April, 2.2 percent, followed by North Dakota, 2.4 percent. The District of Columbia had the highest unemployment rate, 6.2 percent. The next highest rates were in California, Delaware, and Nevada, 5.3 percent each. In total, 17 states had unemployment rates lower than the U.S. figure of 4.3 percent, 6 states and the District had higher rates, and 27 states had rates that were not appreciably different from that of the nation. (See tables A and 1.)
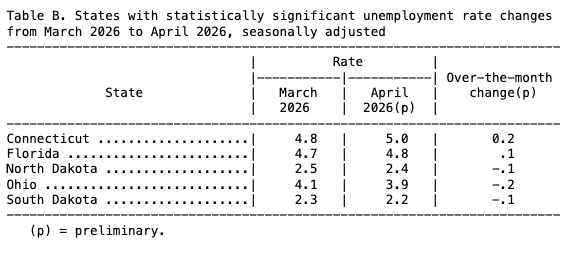
In April, 3 states had unemployment rate decreases: Ohio (-0.2 percentage point) and North Dakota and South Dakota (-0.1 point each). Two states had rate increases: Connecticut (+0.2 percentage point) and Florida (+0.1 point). The remaining 45 states and the District of Columbia had jobless rates that were not notably different from those of a month earlier, though some had changes that were at least as large numerically as the significant changes. (See table B.)
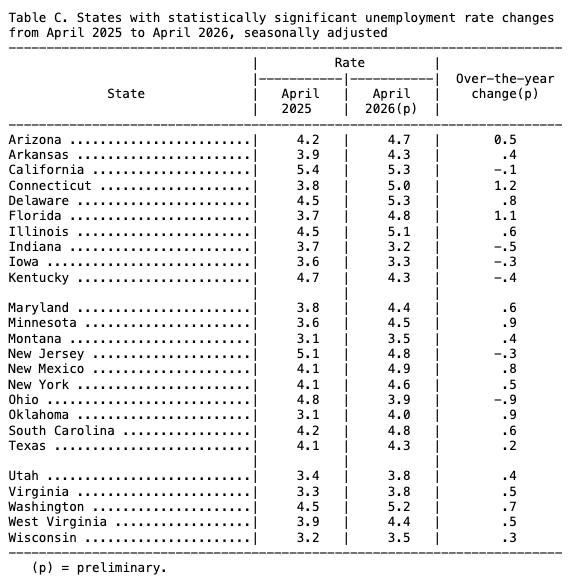
Nineteen states had unemployment rate increases from April 2025, the largest of which were in Connecticut (+1.2 percentage points) and Florida (+1.1 points). Six states had over-the-year rate decreases, the largest of which was in Ohio (-0.9 percentage point). Twenty-five states and the District of Columbia had jobless rates that were not notably different from those ofa year earlier, though some had changes that were at least as large numerically as the significant changes. (See table C.)
Nonfarm Payroll Employment
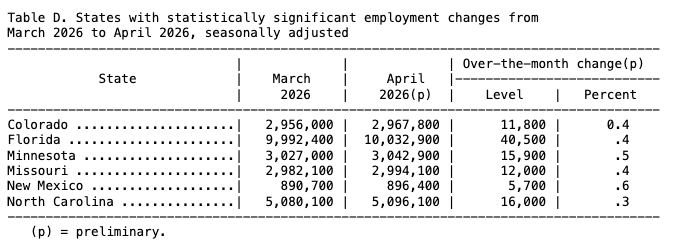
In April 2026, nonfarm payroll employment increased in 6 states and was essentially unchanged in 44 states and the District of Columbia. The largest job gains occurred in Florida (+40,500), North Carolina (+16,000), and Minnesota (+15,900). The largest percentage increases occurred in New Mexico (+0.6 percent) and Minnesota (+0.5 percent), followed by Colorado, Florida, and Missouri (+0.4 percent each). (See tables D and 3.)
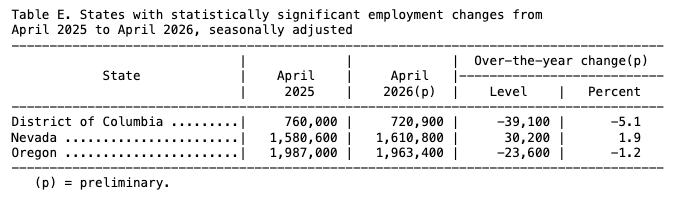
Over the year, nonfarm payroll employment decreased in 1 state and the District of Columbia, increased in 1 state, and was essentially unchanged in 48 states. Employment decreased in the District (-39,100, or -5.1 percent) and Oregon (-23,600, or -1.2 percent). The only job gain occurred in Nevada (+30,200, or +1.9 percent). (See table E.)
_____________
The Metropolitan Area Employment and Unemployment news release for April is scheduled to be released on Wednesday, June 3, 2026, at 10:00 a.m. (ET). The State Employment and Unemployment news release for May is scheduled to be released on Tuesday, June 23, 2026, at 10:00 a.m. (ET).