




 PITTSBURGH — Wesco International announces its results for the second quarter of 2026.
“We delivered another exceptional quarter marked by continued market outperformance and accelerating business momentum. Sales, backlog, adjusted EBITDA, and adjusted earnings per share all increased versus the prior year and achieved records that exceeded our plan. Free cash flow generation was also positive and exceeded our expectations. We have now posted four consecutive quarters of double-digit sales growth fueled by data centers. Beyond our outsized growth in data centers, demand remained strong across the rest of our diversified portfolio and end markets as customers continue to invest in major infrastructure projects. Especially noteworthy, backlog was up approximately 60%, to a new record level, reflecting the benefits of the ongoing secular growth trends and the continued effectiveness of our One Wesco cross-selling strategy. We achieved a major milestone this quarter with a significant multi-year Grid Services award in our UBS business from a hyperscale data center customer. This win represents an important step in diversifying our UBS customer base and expanding our comprehensive data center offerings to include power solutions in addition to our extensive white space and gray space product and service offerings. As recently announced, we also strengthened our end-to-end capabilities and cooling solutions for data center customers through the acquisition of Singapore-based Newark Engineering,” said John Engel, Chairman, President, and CEO.
Engel concluded, “We are very pleased with our second quarter results and continued positive business momentum as we enter the second half of the year. Our backlog growth was fueled by multi-year customer commitments demonstrating our transformation into a leading infrastructure solutions provider serving communications, security, electrical, utility and power markets. The power of our customer value proposition, global capabilities, and leading portfolio of products, services and solutions is clear as we continue to outperform the market. As a result, we are significantly raising our full-year 2026 outlook reflecting the favorable secular growth trends and our confidence in continued strong execution. As the market leader, and with positive momentum building, I’m bullish that Wesco will continue to outperform our markets and deliver superior value to our customers, suppliers, and shareholders in the second half of 2026 and beyond.”
Key Financial Highlights
Net Sales
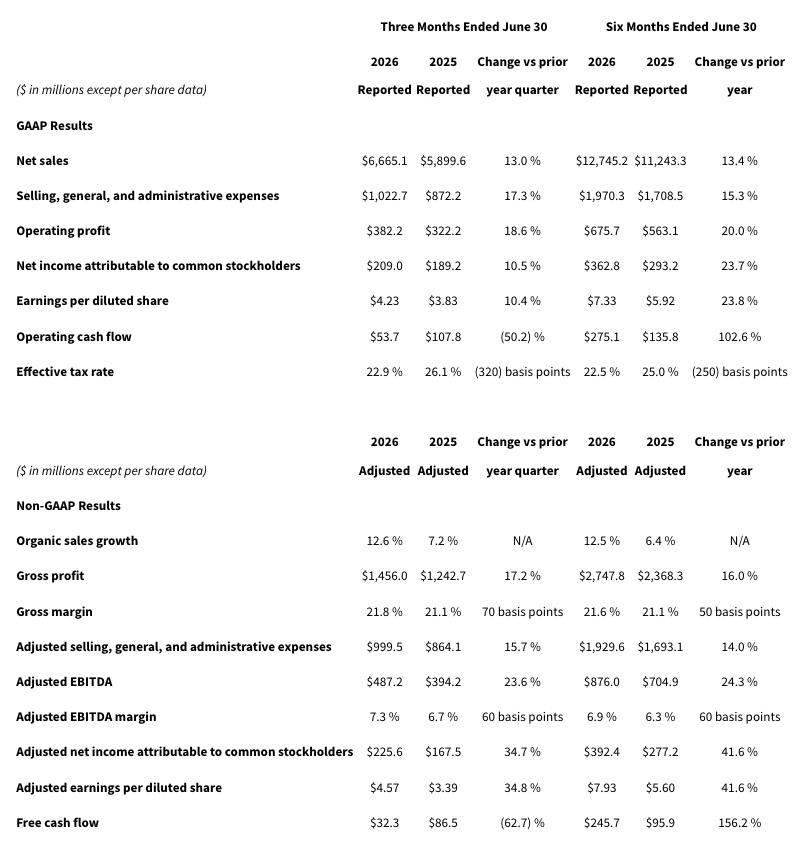
- On an organic basis, which removes differences in foreign exchange rates and the impact from the number of workdays, sales for the second quarter of 2026 grew by 12.6%. The increase in organic sales reflects volume growth in all three segments (CSS, EES and UBS), as well as a favorable impact from changes in price. Sequentially, net sales increased 9.6% and organic sales grew by 6.6%. We had record backlog at the end of the second quarter of 2026, up by approximately 60% compared to the end of the second quarter of 2025.
- For the first six months of 2026, organic sales grew by 12.5%. The increase in organic sales reflects volume growth in all three segments (CSS, EES and UBS), as well as a favorable impact from changes in price.
Gross Profit and Gross Margin
- The increase in gross margin for the three and six months ended June 30, 2026 reflects improved gross margin in the EES and CSS segments, partially offset by a decline in the UBS segment.
Selling, General, and Administrative (“SG&A”) Expenses
- The increase in SG&A expenses for the second quarter of 2026 is primarily driven by an increase in commissions and incentives due to company performance, as well as higher salaries and benefits. SG&A expenses for the second quarter of 2026 include $23.2 million of digital transformation costs, compared to $8.1 million of digital transformation and restructuring costs for the second quarter of 2025. Adjusted for these costs, SG&A expenses were 15.0% and 14.6% of net sales for the second quarter of 2026 and 2025, respectively.
- The increase in SG&A expenses for the first six months of 2026 is primarily driven by an increase in commissions and incentives due to company performance, as well as higher salaries and benefits. SG&A expenses for the first six months of 2026 include $40.7 million of digital transformation costs, compared to $15.4 million of digital transformation and restructuring costs for the first six months of 2025. Adjusted for these costs, SG&A expenses were 15.1% of net sales for the first six months of 2026 and 2025.
Adjusted EBITDA and Adjusted EBITDA Margin
- The increase in adjusted EBITDA and adjusted EBITDA margin for the the second quarter of 2026 primarily reflects higher sales and gross margin. Sequentially, adjusted EBITDA margin increased 90 basis points.
- The increase in adjusted EBITDA for the first six months of 2026 primarily reflects higher sales and gross margin.
Effective Tax Rate
- The lower effective tax rates for the three and six months ended June 30, 2026 are largely driven by higher discrete income tax benefits relating to the exercise and vesting of stock-based awards as compared to the prior year periods.
Adjusted Earnings Per Diluted Share
- The increase in adjusted earnings per diluted share in the second quarter of 2026 reflects higher adjusted EBITDA, as described above. There was also an unfavorable $17.5 million increase in interest expense primarily driven by higher net term debt throughout the quarter compared to the prior year, as well as a $10.0 million non-cash loss on extinguishment from the redemption of the 2028 Notes, partially offset by lower borrowings and lower rates on the Receivables Facility and the Revolving Credit Facility. Additionally, the prior year period included the favorable impact of the June 2025 redemption of the Company’s 10.625% Series A Fixed-Rate Reset Cumulative Perpetual Preferred Stock (the “Series A Preferred Stock”), partially offset by $12.9 million of preferred stock dividends.
- The increase in adjusted earnings per diluted share in the first six months of 2026 reflects higher adjusted EBITDA, partially offset by a $27.9 million increase in interest expense primarily driven by higher net term debt throughout the first six months compared to the prior year, as well as a $10.0 million non-cash loss on extinguishment from the redemption of the 2028 Notes, partially offset by lower borrowings and lower rates on the Receivables Facility and the Revolving Credit Facility. Additionally, the prior year period included the favorable impact of the Series A Preferred Stock redemption, partially offset by $27.3 million of preferred stock dividends.
Operating Cash Flow
- Net cash provided by operating activities for the second quarter of 2026 totaled $53.7 million compared to $107.8 million in the second quarter of 2025. The $54.1 million decrease is driven by a $182.8 million impact from changes in trade accounts receivable and a $155.3 million impact from changes in other current and noncurrent assets. The impact from trade accounts receivable was primarily due to sales growth in all three segments, as well as the timing of receipts from customers as compared to the prior year, and the impact from other current and noncurrent assets was primarily due to increases in supplier prepayments. These decreases were partially offset by a $129.9 million impact from changes in other current and noncurrent liabilities, driven by increases in deferred revenue. Additionally an increase in net income as adjusted for certain non-cash items also offset the decrease in operating cash flows.
- Net cash provided by operating activities for the first six months of 2026 totaled $275.1 million, compared to $135.8 million for the first six months of 2025. The $139.3 million increase is driven by a $170.4 million impact from changes in other current and noncurrent liabilities, primarily due to increases in deferred revenue. Accounts payable additionally contributed to the increase, with a $151.3 million impact driven by increased inventory purchases, as well as the timing of inventory purchases and payments to suppliers as compared to the prior year. An increase in net income as adjusted for certain non-cash items also contributed to the increase in operating cash flows. These increases were partially offset by a $209.8 million impact from changes in trade accounts receivable and a $168.1 million impact from changes in other current and noncurrent assets. The impact from trade accounts receivable was primarily due to sales growth in all three segments, as well as the timing of receipts from customers as compared to the prior year, and the impact from other current and noncurrent assets was primarily due to increases in supplier prepayments.