





 MILWAUKEE — Rockwell Automation, Inc. today reported third-quarter fiscal 2026 results.
“Our strong third-quarter performance reflects healthy customer demand, an accelerated pace of innovation, and disciplined execution. Continued strength in semiconductor, data center, and warehouse automation, as well as improving activity in automotive and life sciences, drove growth across the business. Our 10% organic sales growth, combined with favorable mix and operational discipline, yielded double-digit earnings growth and expanded margins,” said Blake Moret, Chairman and CEO.
Fiscal Q3 2026 Financial Results
On April 1, the Company completed the dissolution of the Sensia joint venture, which included the divestiture of certain businesses to the joint venture partner. Prior period reported sales and total ARR have been adjusted to calculate organic sales and ARR.
Fiscal 2026 third quarter sales were $2,313 million, up 8% from $2,144 million in the third quarter of fiscal 2025. Organic sales increased 10%. Divestitures decreased sales by (3)% and currency translation increased sales by 1%.
Income before income taxes was $470 million in the third quarter of fiscal 2026 compared to $342 million in the same period last year. Pre-tax margin was 20.3% in the third quarter of fiscal 2026 compared to 16.0% in the same period last year. Enterprise operating profit was $516 million in the third quarter of fiscal 2026, up 23% from $418 million in the same period of fiscal 2025. Enterprise operating margin was 22.3% compared to 19.5% a year ago. The increases in pre-tax margin and Enterprise operating margin were primarily due to higher sales volume, favorable mix, and the margin benefit of the Sensia joint venture dissolution, partially offset by negative price/cost.
Fiscal 2026 third quarter Net income attributable to Rockwell Automation was $408 million or $3.65 per share, compared to $295 million or $2.60 per share in the third quarter of fiscal 2025. The increases in Net income attributable to Rockwell Automation and diluted EPS were primarily due to higher pre-tax margin. Fiscal 2026 third quarter Adjusted EPS was $3.49, up 22% compared to $2.85 in the third quarter of fiscal 2025 primarily due to higher Enterprise operating margin.
Cash provided by operating activities in the third quarter of fiscal 2026 was $724 million compared to $527 million in the third quarter of fiscal 2025. Free cash flow in the third quarter of fiscal 2026 was $654 million, compared to $489 million in the same period last year. Increases in cash provided by operating activities and free cash flow were primarily due to higher pre-tax income.
Fiscal Year 2026 Outlook
The table below provides updated fiscal 2026 guidance.
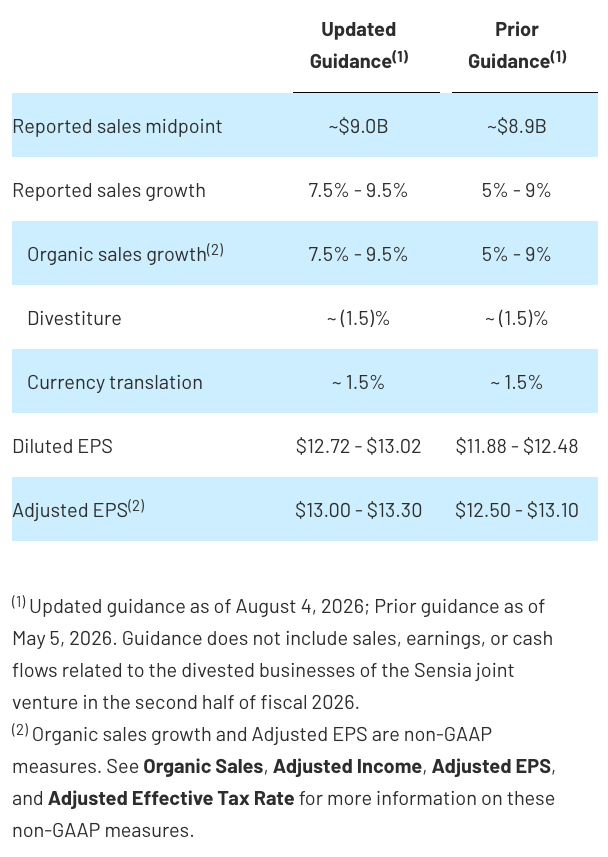
“Our updated fiscal 2026 outlook reflects the strong execution of our team and our confidence in the opportunities ahead. We continue to perform at the high end of our growth framework while expanding margins and investing in innovation. With a differentiated portfolio, a world-class partner ecosystem, and a highly engaged team, we are well positioned to extend our leadership and deliver sustainable value over the long term,” Moret continued.
Following is a discussion of third quarter results for our business segments.
Intelligent Devices
Intelligent Devices third quarter fiscal 2026 sales were $1.1 billion, an increase of 12% compared to $968 million in the same period last year. Organic sales increased 10% and currency translation increased sales by 2%. Segment operating earnings were $216 million compared to $182 million in the same period last year. Segment operating margin increased to 20.0% from 18.8% a year ago. The increase in segment operating margin from prior year was driven by higher sales volume, favorable currency, and favorable mix, partially offset by negative price/cost.
Software & Control
Software & Control third quarter fiscal 2026 sales were $751 million, an increase of 19% compared to $629 million in the same period last year. Organic sales increased 18% and currency translation increased sales by 1%. Segment operating earnings were $261 million compared to $199 million in the same period last year. Segment operating margin increased to 34.8% from 31.6% a year ago driven by higher sales volume, partially offset by negative price/cost.
Lifecycle Services
Lifecycle Services third quarter fiscal 2026 sales were $482 million, a decrease of (12)% compared to $547 million in the same period last year. Organic sales decreased (2)%. Divestitures decreased sales by (11)% and currency translation increased sales by 1%. Segment operating earnings were flat year over year at $73 million. Segment operating margin increased to 15.1% from 13.3% a year ago driven by strong project execution and the margin benefit from the Sensia joint venture dissolution, partially offset by lower sales volume.
Supplemental Information
ARR – Organic ARR grew 6% compared to the end of the third quarter of fiscal 2025.
Corporate and other – Fiscal 2026 third quarter Corporate and other expense was $34 million compared to $36 million in the third quarter of fiscal 2025.
Amortization of acquisition-related intangible assets – Fiscal 2026 third quarter Amortization of acquisition-related intangible assets expense was $30 million, compared to $35 million in the third quarter of fiscal 2025.
Tax – On a GAAP basis, the effective tax rate in the third quarter of fiscal 2026 was 13.2% compared to 14.3% in the third quarter of fiscal 2025. The decrease in the effective tax rate was primarily due to the favorable discrete tax items related to the dissolution of the Sensia joint venture, partially offset by the impact of BEPS Pillar Two minimum tax rules. The Adjusted Effective Tax Rate for the third quarter of fiscal 2026 was 19.2% compared to 15.3% in the prior year. The increase in the Adjusted Effective Tax Rate was primarily due to the impact of BEPS Pillar Two.
Share repurchases – During the third quarter of fiscal 2026, the Company repurchased approximately 0.3 million shares of its common stock at a cost of $145 million. At June 30, 2026, approximately $1.2 billion remained available under our existing share repurchase authorizations.
Return on Invested Capital (ROIC) – On a GAAP basis, ROIC was 18.4% for the twelve months ended June 30, 2026, compared to 16.3% for the twelve months ended June 30, 2025. Adjusted ROIC was 18.8% for the twelve months ended June 30, 2025, compared to 15.0% for the twelve months ended June 30, 2025.
Net Income and Adjusted EBITDA – Net Income was $408 million for the three months ended June 30, 2026, compared to $293 million for the three months ended June 30, 2025. Adjusted EBITDA was $565 million for the three months ended June 30, 2026, compared to $461 million for the three months ended June 30, 2025. The increase was primarily driven by higher net income.
Tagged with financial results, Rockwell