






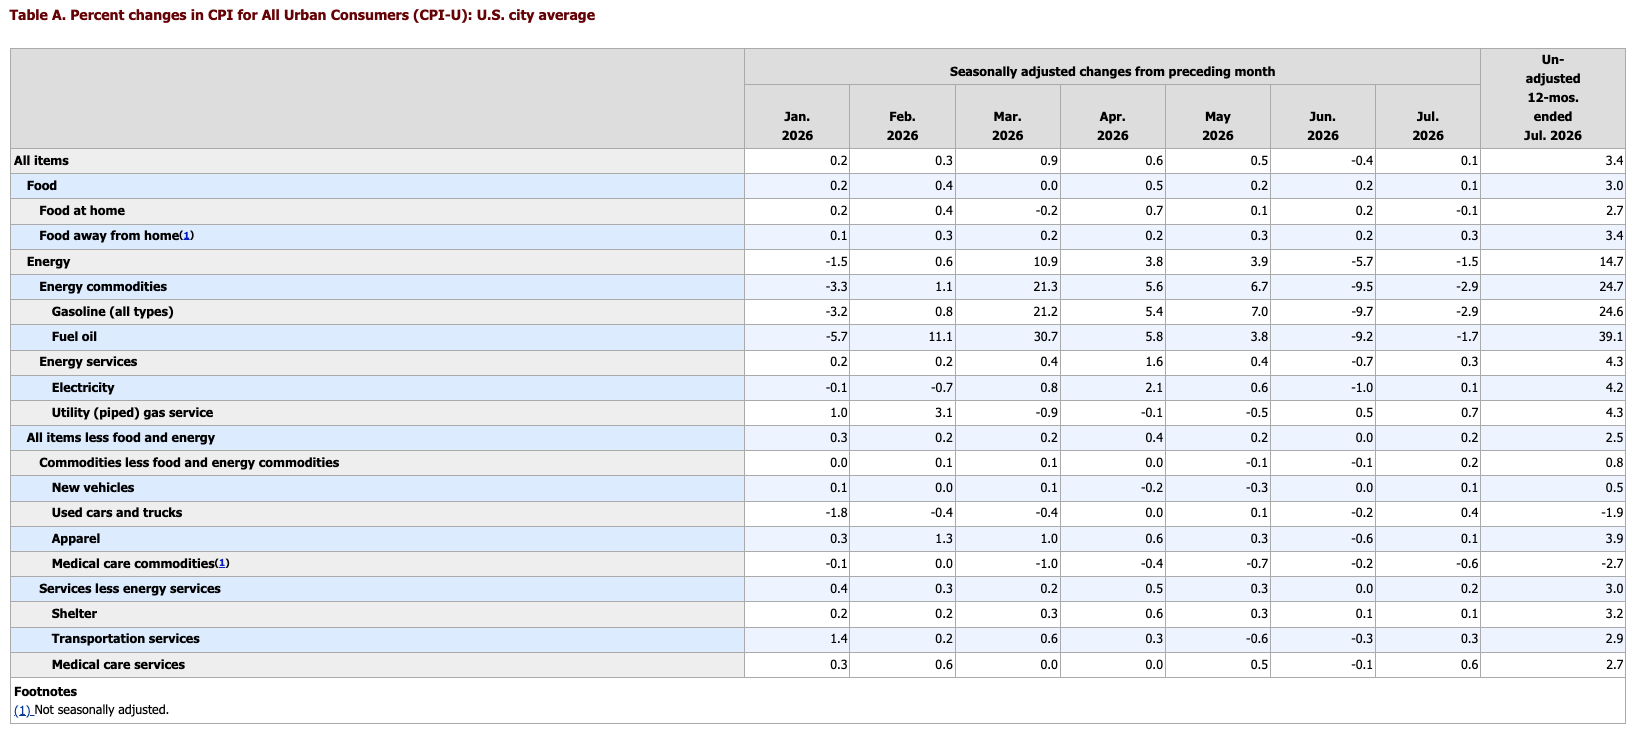
(BLS) The Bureau of Labor Statistics today reported that the Consumer Price Index for All Urban Consumers (CPI-U) increased 0.1 percent on a seasonally adjusted basis in July after falling 0.4 percent in June. Over the last 12 months, the all items index increased 3.4 percent before seasonal adjustment.
The index for shelter rose 0.1 percent in July, accounting for roughly two-thirds of the monthly all items increase. The index for food also increased 0.1 percent over the month, as the index for food away from home increased 0.3 percent. In contrast, the energy index declined 1.5 percent in July.
The index for all items less food and energy rose 0.2 percent after being unchanged in June. Indexes that increased over the month include medical care, airline fares, communication, education, and recreation. Conversely, the index for motor vehicle insurance was among the major indexes that decreased in July.
The all items index rose 3.4 percent for the 12 months ending July after rising 3.5 percent for the 12 months ending June. The all items less food and energy index rose 2.5 percent over the year, following a 2.6-percent increase over the 12 months ending June. The energy index increased 14.7 percent for the 12 months ending July. The food index increased 3.0 percent over the last year.
Food
The food index rose 0.1 percent in July, after rising 0.2 percent in June. The index for food at home decreased 0.1 percent over the month. Three of the six major grocery store food group indexes decreased in July. The meats, poultry, fish, and eggs index decreased 0.7 percent over the month as the pork index declined 1.5 percent. The index for fruits and vegetables decreased 0.1 percent in July as the index for lettuce fell 16.4 percent. The dairy and related products index decreased 0.1 percent over the month. The index for other food at home was unchanged in July.
In contrast, the nonalcoholic beverages index rose 0.9 percent in July after falling 1.5 percent in June. The index for cereals and bakery products increased 0.2 percent over the month.
The food away from home index rose 0.3 percent in July. The index for limited service meals rose 0.4 percent, and the index for full service meals rose 0.2 percent over the month.
The index for food at home rose 2.7 percent over the 12 months ending in July. The fruits and vegetables index rose 5.1 percent over the last 12 months. The index for other food at home increased 2.5 percent, and the index for nonalcoholic beverages rose 4.1 percent over the year. The meats, poultry, fish, and eggs index increased 1.9 percent over the 12 months ending in July, and the cereals and bakery products index rose 2.7 percent over the same period. In contrast, the index for dairy and related products fell 0.5 percent over the year.
The food away from home index rose 3.4 percent over the last year. The index for full service meals rose 3.4 percent, and the index for limited service meals rose 3.3 percent over the 12 months ending in July.
Energy
The index for energy decreased 1.5 percent in July, after falling 5.7 percent in June. The gasoline index decreased 2.9 percent over the month. (Before seasonal adjustment, gasoline prices decreased 2.1 percent in July.) Conversely, the index for natural gas increased 0.7 percent in July, and the index for electricity rose 0.1 percent.
The index for energy increased 14.7 percent over the past 12 months due in large part to the index for gasoline rising 24.6 percent over the same period. The natural gas index increased 4.3 percent over the 12 months ending in July, and the electricity index rose 4.2 percent.
All items less food and energy
The index for all items less food and energy rose 0.2 percent in July after being unchanged in June. The shelter index increased 0.1 percent over the month, as it did in June. The index for owners’ equivalent rent rose 0.3 percent in July as did the index for rent. The lodging away from home index fell 2.8 percent over the month.
The medical care index increased 0.4 percent in July after falling 0.1 percent in June. The index for hospital services increased 0.5 percent over the month, and the index for physicians’ services increased 0.2 percent. Conversely, the prescription drugs index decreased 0.8 percent in July.
The index for airline fares increased 2.2 percent over the month after rising 0.2 percent in June. The communication index rose 0.6 percent in July, and the education index increased 0.5 percent. The index for recreation increased 0.2 percent in July, and the index for used cars and trucks rose 0.4 percent. The indexes for new vehicles, household furnishings and operations, and apparel also increased over the month.
The motor vehicle insurance index declined 0.3 percent in July after falling 2.0 percent in June. The index for personal care was unchanged in July.
The index for all items less food and energy rose 2.5 percent over the past 12 months. The shelter index increased 3.2 percent over the last year. Other indexes with notable increases over the last year include airline fares (+25.5 percent), medical care (+1.7 percent), recreation (+2.6 percent), and household furnishings and operations (+2.2 percent).
Not seasonally adjusted CPI measures
The Consumer Price Index for All Urban Consumers (CPI-U) increased 3.4 percent over the last 12 months to an index level of 333.918 (1982-84=100). For the month, the index was unchanged prior to seasonal adjustment.
The Consumer Price Index for Urban Wage Earners and Clerical Workers (CPI-W) increased 3.4 percent over the last 12 months to an index level of 327.104 (1982-84=100). For the month, the index was unchanged prior to seasonal adjustment.
The Chained Consumer Price Index for All Urban Consumers (C-CPI-U) increased 3.3 percent over the last 12 months. For the month, the index was unchanged on a not seasonally adjusted basis. Please note that the indexes for the past 10 to 12 months are subject to revision.
Tagged with consumer prices, economy