


By Jim Williams
There are two key numbers for those watching copper prices – $7,000 and $3.00. The numbers represent the price per ton ($7K) and per pound ($3). When the price dips below either number there is cause for concern with investors.
Well, there is cause today. In New York trade on the Comex market on Monday, December copper dipped to $2.9670 a pound, falling below the psychologically important $3-level for only the second time since March’s near 4-year low.
In afternoon trade the red metal bounced back a little to finish at $2.9865. That slight recovery is ahead of the release of economic growth data from China later today.
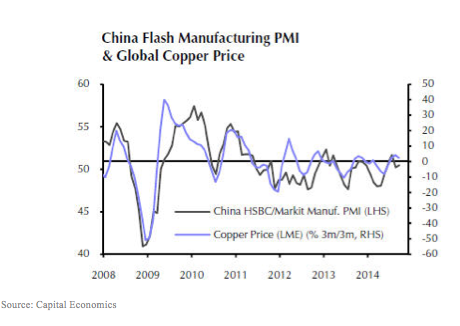
Analysts expect China’s economy to grow 7.2% in the three months ending September 30. That is down from growth of 7.5% in the preceding quarter and the slowest pace since 2009 (see chart).

Given its widespread use in transportation, manufacturing and construction the copper price is sensitive to any economic slowdown.
“The market always wants to see China buying…[but] there isn’t a belief that this is going to turn into more industrial production,” said John Payne, senior market analyst with Daniels Trading in Chicago.
As the world’s top copper consumer by volume, China has kept the market under siege throughout 2014. A slowdown in manufacturing and construction, as well as slower overall economic expansion, has led to weaker global prices for the metal.
China’s initial manufacturing PMI for October will be released on Thursday. It is expected to show further cooling of the country’s manufacturing industry, which as the graph above shows is a good indicator of the direction of the copper price.
On top of the uncertainty about China, copper traders are facing the prospect of reduced metal consumption in the U.S. and Europe. Recent data showed factory-gate prices in the U.S. fell last month, while retail sales were weaker than expected. In Europe, industrial output slowed 1.8% in August from a month earlier.
“The landscape for demand for copper still looks quite weak as the majority of the globe is slowing down, China included,” said James Cordier, president of Liberty Trading Group in Tampa, Fla.
Slowing demand from China and Europe and particularly growing supply worries have seen the price of copper fall 11% in 2014.
By the way, that ‘other’ number, $7,000 per ton? There is cause for concern there as well. Copper LME Settlement Price is at a current level of $6,872.22, down from $7,001.84 last month and down from $7,159.27 one year ago. This is a change of -1.85% from last month and -4.01% from one year ago. Please see LME Settlement Price Historical Data below.
Supply and Demand (Or Lack of Demand)
The price of copper was a hot topic at the start of LME Week in London, the biggest annual gathering of the metals and mining industry.
Lackluster demand and a surplus of supply are expected to be key factors in the price of the red metal for the rest of this year and into 2015.
In China, some of the metal stored in warehouses is already trickling onto the market in the wake of the discovery of a massive fraud at the port of Qingdao (reported in this space a number of times). The fraud has made it more difficult to use the supply in China to obtain letters of credit. Problems at the port have also increased the odds that the metal will change hands, said Vanessa Davidson, copper group manager at CRU.
CRU is forecasting that bonded warehouse stockpiles of copper will decline by up to 200,000 tons next year, one factor that is expected to help dent that China’s imports of copper. Davidson predicts the same factors will drive an increase in the global copper surplus in 2016.
Copper LME Settlement Price Historical Data
| Sept. 30, 2014 |
6872.22 |
|
Aug. 31, 2014 |
7001.84 |
|
July 31, 2014 |
7113.38 |
|
June 30, 2014 |
6821.14 |
|
May 31, 2014 |
6891.13 |
|
April 30, 2014 |
6673.56 |
|
March 31, 2014 |
6650.04 |
|
Feb. 28, 2014 |
7149.21 |
|
Jan. 31, 2014 |
7291.47 |
|
Dec. 31, 2013 |
7214.90 |
|
Nov. 30, 2013 |
7070.65 |
|
Oct. 31, 2013 |
7203.02 |
|
Sept. 30, 2013 |
7159.27 |
|
Aug. 31, 2013 |
7192.92 |
|
July 31, 2013 |
6906.64 |
|
June 30, 2013 |
7000.24 |
|
May 31, 2013 |
7249.41 |
|
April 30, 2013 |
7234.28 |
|
March 31, 2013 |
7645.58 |
|
Feb. 28, 2013 |
8060.92 |
|
Jan. 31, 2013 |
8047.36 |
|
Dec. 31, 2012 |
7966.49 |
|
Nov. 30, 2012 |
7711.23 |
|
Oct. 31, 2012 |
8062.03 |
|
Sept. 30, 2012 |
8087.74 |
|
Aug. 31, 2012 |
7515.53 |
|
July 31, 2012 |
7584.26 |
|
June 30, 2012 |
7423.02 |
|
May 31, 2012 |
7955.64 |
|
April 30, 2012 |
8289.48 |
|
March 31, 2012 |
8470.78 |
|
Feb. 29, 2012 |
8441.49 |
|
Jan. 31, 2012 |
8040.47 |
|
Dec. 31, 2011 |
7565.48 |
|
Nov. 30, 2011 |
7581.02 |
|
Oct. 31, 2011 |
7394.19 |
|
Sept. 30, 2011 |
8300.14 |
|
Aug. 31, 2011 |
9000.76 |
|
July 31, 2011 |
9650.46 |
|
June 30, 2011 |
9066.85 |
|
May 31, 2011 |
8959.90 |
|
April 30, 2011 |
9492.79 |
|
March 31, 2011 |
9503.36 |
|
Feb. 28, 2011 |
9867.60 |
|
Jan. 31, 2011 |
9555.70 |
|
Dec. 31, 2010 |
9147.26 |
|
Nov. 30, 2010 |
8469.89 |
|
Oct. 31, 2010 |
8292.40 |
|
Sept. 30, 2010 |
7709.30 |
|
Aug. 31, 2010 |
7283.95 |