


By Jim Williams
Copper prices continued their alarming fall this week after a pair of reports on China’s manufacturing sector added to concerns over the slowdown in the world’s second largest economy.
The final Caixin/Markit manufacturing purchasing managers’ index for August came in at 47.3, the lowest reading since March 2009. Meanwhile, the official China’s manufacturing purchasing managers’ index (PMI) dipped to 49.7 in August from 50.0 in July, the weakest level since August 2012. Anything below 50.0 indicates industry contraction.
Copper prices sank to a six-year low of $2.202 on August 24 as concerns over the health of China’s economy and steep declines on Chinese stock markets dampened appetite for the red metal.
The extended tumble in markets began when China unexpectedly devalued the yuan on August 11 ($1 = 6.3760 Chinese yuan), sparking fears the economy may be slowing at a faster than expected rate.
“Nothing in copper goes right until China gets on track,”Ira Epstein, a broker with Linn & Associates in Chicago tells NASDAQ.com. “They have to spend money at home,”he said, adding that Chinese authorities have more room to cut both interest rates and bank reserve requirements in order to bolster business activity.
Reuters published a report by a government newspaper earlier this week claiming China will spend at least 2 trillion yuan ($315 billion) to improve its power grid infrastructure over the 2015-2020 period. The article says despite falling power consumption growth, China is working to upgrade its cross-country power transmission capacity in order to reduce coal consumption along the smog-hit eastern coast and provide markets for energy producers in the resource-rich far west, where electricity demand is considerably weaker.
Another report, this one published on the website of the National Energy Administration (NEA), ChinaElectric Power News said the country was aiming to increase the total length of its high-voltage transmission lines to 1.01 million km (627,585 miles) by the end of 2020, more than double the 2014 level. Citing a new government action plan, it said China would work to make prices more flexible in order to reflect changes in costs and fluctuations in demand.
Experts predict the 2015-2020 investment is likely to provide a boost for sectors like copper. According to Yang Changhua, senior analyst at state-backed research firm Antaike, the plan was aimed at increasing the reliability of power transmission, which would favor copper-based cables over cheaper alternative aluminum-based cables.
We asked our expert, Jesse Colombo, an economic analyst and contributor to Forbes Investing, to look into his ‘crystal ball’ and tell us where he thinks copper is going.
Here is what he put together for us…
Where Is Copper Headed Next?
Since my copper update last month, copper has continued its bear market thanks to China’s economic slowdown and stock market crash. I’ve been warning about an upcoming copper plunge for several years because I believed it was a part of the overall commodities bubble and exposed to China’s economic bubble. So far, this view has proven correct as copper has slid to lows last seen in 2009. I am still concerned about further downside because I believe that China’s economic problems are far from over. In this piece, I will analyze copper’s charts to determine its next short-term move.
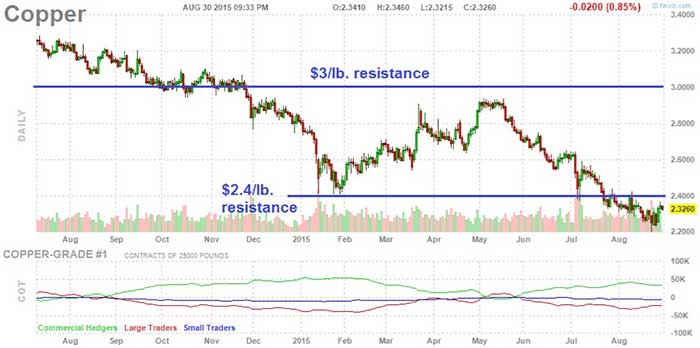
Copper recently fell below its $2.40 support level that formed at the January lows. This level is now a resistance level that copper needs to surpass to negate the recent breakdown. If copper stays below this level, however, further bearish action is likely.

Source: Finviz.com
The weekly copper chart shows how copper fell under both its longer-term $3/lb. and $2.4/lb. support levels. The downtrend is still intact as long as copper is below these levels.

Source: Finviz.com
The monthly copper chart shows the 2009 low of around $1.25/lb. as the next obvious support level and price target that copper may try to reach as long as the bear market remains in force.

Source: Finviz.com
I watch the U.S. dollar very closely for insight into copper and other commodities’ next moves. The dollar trades inversely with copper, so dollar strength is bearish for copper and vice versa. The U.S. Dollar Index has been consolidating since the start of this year in what appears to be a wedge pattern with a support level at 93.
If the Dollar Index is able to break above this wedge pattern as well as the 100 resistance level for further confirmation, another bullish leg of the dollar bull market may ensue along with further copper weakness. I discussed several reasons why more strength may be ahead for the dollar in a recent piece. If the Dollar Index breaks below the 93 support level, however, the dollar may weaken.

Source: Barchart.com
For now, the U.S. dollar and the health of China’s financial market and economy are the most important copper influences to watch. If China’s stock bear market continues, copper will likely be dragged down with it. See my latest analysis of China’s stock market for further insight.
Please follow or add Jesse on Twitter, Facebook, and LinkedIn to stay informed about the most important trading and bubble news as well as his related commentary.
(Disclaimer: All information is provided for educational purposes only and should not be relied on for making any investment decisions. The chart analysis blog posts provided by Jesse are simply market “play by plays” and color commentaries, not hard predictions, as the author is an agnostic on short-term market movements.)
Tagged with tED