![]() CHICAGO — Grainger today reported results for the fourth quarter and full-year 2019. For the full year, sales of $11.5 billion increased 2.5 percent versus $11.2 billion in the prior year. Sales of $2.8 billion in the 2019 fourth quarter increased 3 percent versus the 2018 fourth quarter.
CHICAGO — Grainger today reported results for the fourth quarter and full-year 2019. For the full year, sales of $11.5 billion increased 2.5 percent versus $11.2 billion in the prior year. Sales of $2.8 billion in the 2019 fourth quarter increased 3 percent versus the 2018 fourth quarter.
“In 2019, we grew sales, operating earnings and EPS despite challenging and uncertain economic conditions. Our sales growth in the U.S. outperformed the market throughout the year, and our share gain accelerated in the fourth quarter, as our growth initiatives began to take hold. At our U.S. endless assortment business, Zoro, we continued to invest in the business to ensure ongoing success. At the total company level, our strong expense control held SG&A stable and enabled our advertising, technology and Zoro investments,” said DG Macpherson, Chairman and Chief Executive Officer. “As we look to 2020, we will diligently manage expenses while continuing to invest in future growth. We are confident in our strategy and ability to execute moving forward.”
2019 Financial Summary
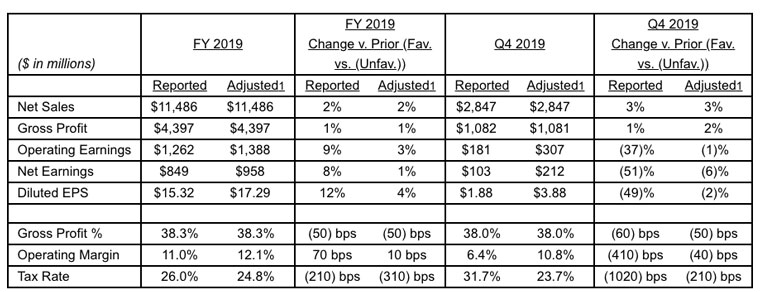
(1) Results exclude restructuring and income tax items as shown in the supplemental information to this release. Reconciliations of the adjusted measures reflected in this table to the most directly comparable GAAP measures are provided in the supplemental information to this release.
Revenue
For the full year 2019, total company sales increased 2.5 percent versus the full year 2018, including a 0.5 percent negative impact of foreign currency exchange. On a constant currency basis, sales increased 3 percent driven by volume growth of 2.5 percent and favorable price of 0.5 percent.
For the fourth quarter 2019, total company sales increased 3.0 percent versus the prior year period driven by volume growth of 3.5 percent and unfavorable price of 0.5 percent. There was no foreign currency exchange impact in the fourth quarter.
Gross Profit Margin
For the full year 2019, reported and adjusted gross profit margin was 38.3 percent, down 50 basis points, versus the full year 2018 gross profit margin of 38.7 percent.
Reported gross profit margin for the fourth quarter was 38.0 percent, down 60 basis points, versus the 2018 fourth quarter gross profit margin of 38.6 percent. Adjusted gross profit margin for the quarter was 38.0 percent, down 50 basis points, versus the 2018 fourth quarter gross profit margin of 38.5 percent. The lower gross profit margin was primarily driven by product and customer mix in the U.S. Segment and total company business unit mix driven by faster growth with the lower margin endless assortment businesses.
Earnings
For the full year 2019, reported operating earnings of $1.3 billion were up 9 percent versus $1.2 billion in 2018. On an adjusted basis, operating earnings for 2019 were $1.4 billion, up 3 percent versus $1.3 billion in 2018. Reported operating margin of 11.0 percent increased 70 basis points versus the prior year. Adjusted operating margin of 12.1 percent increased 10 basis points versus the prior year due primarily to operating expense leverage. Reported earnings per share of $15.32 were up 12 percent versus $13.73 in 2018. Adjusted earnings per share of $17.29 increased 4 percent versus $16.70 in 2018. The increase in adjusted earnings per share was due primarily to higher operating earnings, partially offset by a higher tax rate.
Reported operating earnings for the 2019 fourth quarter of $181 million were down 37 percent versus $290 million in the 2018 fourth quarter. During the quarter, the company recorded a $120 million write-down of substantially all of the remaining intangible assets of the Cromwell business which was the primary driver of the decline in reported operating earnings. On an adjusted basis, operating earnings for the quarter of $307 million were down 1 percent versus $310 million in the 2018 quarter. Reported operating margin of 6.4 percent declined 410 basis points versus the prior year. Adjusted operating margin of 10.8 percent declined 40 basis points versus the prior year due primarily to lower gross profit margin in the quarter. Reported earnings per share of $1.88 in the fourth quarter were down 49 percent versus $3.68 in the 2018 quarter. Adjusted earnings per share in the quarter of $3.88 decreased 2 percent versus $3.96 in the 2018 fourth quarter. The decline in adjusted earnings per share was due primarily to a higher tax rate in the quarter.
Tax Rate
For the full year 2019, the company’s reported tax rate was 26.0 percent versus 23.9 percent in 2018. The adjusted tax rate for the full year was 24.8 percent versus 21.7 percent in 2018.
For the fourth quarter 2019, the company’s reported tax rate was 31.7 percent versus 21.5 percent in the 2018 fourth quarter. The company’s adjusted tax rate for the fourth quarter 2019 was 23.7 percent versus 21.6 percent in the fourth quarter 2018.
The 2019 tax rates for the quarter and full year contained no tax benefit from the clean energy investments which were concluded in 2018. For the full year, the 2019 tax rates also contained a lower benefit from stock-based compensation than the prior year. In addition, the company recorded a valuation allowance to reduce the future tax benefits from Cromwell, increasing the reported tax rate for the quarter.
Cash Flow
For the full year 2019, the company generated operating cash flow of $1,042 million. This represents a minor year over year decrease primarily related to employee variable compensation payments, partially offset by favorable net income and changes in working capital. The company used the cash generated during the year to invest in the business and return cash to shareholders through share repurchases and dividends. In 2019, capital expenditures were $221 million. Grainger returned $1,028 million to shareholders through $328 million in dividends and $700 million used to buy back 2.4 million shares in 2019.
Operating cash flow for the quarter was $272 million versus $314 million in the 2018 fourth quarter, a decrease of 13 percent compared to the same period last year. The majority of this decline was driven by lower net income and working capital timing.
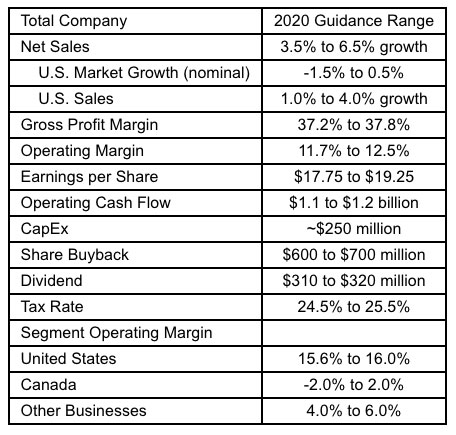
2020 Company Guidance:
The company is providing the following 2020 guidance: