


Nineteenth Consecutive Quarter of Year-Over-Year Average Daily Sales Growth
Fourth-Quarter Results
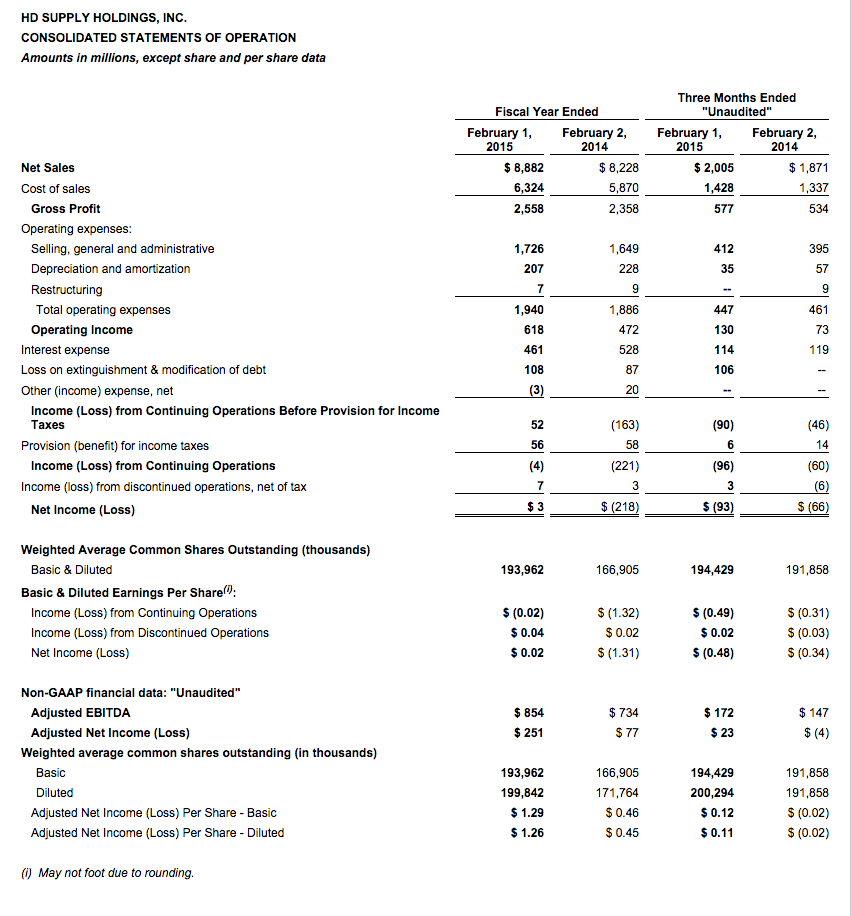
- Net Sales increased 7 percent to $2,005 million
- Operating Income improved 78 percent to $130 million
- Adjusted EBITDA increased 17 percent to $172 million
- Adjusted Net Income per diluted share increased $0.13 to $0.11 (Net Loss per diluted share of $0.48)
Fiscal 2014 Results
- Net Sales increased 8 percent to $8,882 million
- Operating Income improved 31 percent to $618 million
- Adjusted EBITDA increased 16 percent to $854 million
- Adjusted Net Income per diluted share increased $0.81 to $1.26 (Net Income per diluted share of $0.02)
ATLANTA, GA — HD Supply Holdings, Inc. (Nasdaq:HDS) reported Net sales of $9.0 billion for the full-year fiscal 2014 ended February 1, 2015, an increase of $654 million, or 8 percent, as compared to fiscal 2013. The company believes its sales performance represents growth of approximately 400 basis points in excess of its market growth estimate.
“I am very pleased with our solid 2014 performance. We delivered 8 percent sales growth and 16 percent Adjusted EBITDA growth,” stated Joe DeAngelo, CEO of HD Supply. “Despite a challenging and uncertain market environment, we remain focused on controllable execution to deliver profitable growth in excess of our markets.”
On January 12, 2015, the company completed the sale of substantially all of the assets of its Hardware Solutions business to The Home Depot and received cash proceeds of approximately $198 million, net of transaction costs. As a result of the sale, the company recorded an $8 million pre-tax gain in fiscal 2014. In accordance with Accounting Standard Codification 205-20, Discontinued Operations, the results of Hardware Solutions are classified as discontinued operations for all periods presented.
Gross profit increased $200 million, or 8 percent, to $2,558 million for the full-year fiscal 2014 compared to $2,358 million for the full-year fiscal 2013. Gross profit was 28.8 percent of Net sales for the full-year fiscal 2014, up approximately 10 basis points from 28.7 percent of Net sales for the full-year fiscal 2013. The improvement in gross margin was primarily driven by our category management initiatives, partially offset by the competitive environment, and mix of products and services.
Operating income increased $146 million, or 31 percent, to $618 million for the full-year fiscal 2014 compared to $472 million for the full-year fiscal 2013. Operating income as a percentage of Net sales increased approximately 130 basis points during the full-year fiscal 2014 as compared to the full-year fiscal 2013. The improvement was primarily driven by the leverage of fixed costs through sales volume increases, disciplined cost control and a reduction of amortization expense on certain acquisition-related intangible assets.
Adjusted EBITDA increased $120 million, or 16 percent, to $854 million for the full-year fiscal 2014 compared to $734 million for the full-year fiscal 2013. The increase in Adjusted EBITDA reflects the continued focus on initiatives execution to drive growth in excess of our estimate of market growth and the leverage of fixed costs through sales volume increases. Adjusted EBITDA as a percentage of Net sales increased approximately 70 basis points to 10 percent in the full-year fiscal 2014 as compared to 9 percent in the full-year fiscal 2013.
Net income for full-year fiscal 2014 was $3 million, which included a $108 million loss on extinguishment and modification of debt and a $7 million restructuring charge. Net loss for full-year fiscal 2013 was $218 million, which included an $87 million loss on extinguishment and modification of debt and a $12 million restructuring charge. Net income per diluted share was $0.02 in the full-year of fiscal 2014, as compared to a net loss per diluted share of $1.31 in the full-year fiscal 2013.
Adjusted net income increased $174 million to $251 million for the full-year fiscal 2014 as compared to an Adjusted net income of $77 million for the full-year fiscal 2013. The increase in Adjusted net income is primarily attributable to sales growth, the leverage of fixed costs through sales volume increases, and a reduction in interest expense. Adjusted net income per diluted share was $1.26 in the full-year fiscal 2014, as compared to $0.45 in the full-year fiscal 2013.
As of February 1, 2015, HD Supply’s combined liquidity of approximately $1,248 million was comprised of $85 million in cash and cash equivalents and $1,163 million of additional available borrowings under HD Supply, Inc.’s senior asset-backed lending facility, based on qualifying inventory and receivables.
Fourth-Quarter 2014 Results
Net Sales increased $134 million, or 7 percent, to $2,005 million for the fourth quarter of fiscal 2014 as compared to the fourth quarter of fiscal 2013.
Net sales for November, December and January of fiscal 2014 were $648 million, $587 million and $770 million, respectively. There were 18 selling days in November, 19 selling days in December and 24 selling days in January. Average year-over-year daily sales growth for November, December and January were 6.3 percent, 5.9 percent and 8.8 percent, respectively.
Gross profit increased $43 million, or 8 percent, to $577 million for the fourth quarter of fiscal 2014, compared to $534 million for the fourth quarter of fiscal 2013. Gross profit was 28.8 percent of Net sales for the fourth quarter of fiscal 2014, up approximately 30 basis points from 28.5 percent of Net sales for the fourth quarter of fiscal 2013.
Operating income increased $57 million, or 78 percent, to $130 million for the fourth quarter of fiscal 2014, compared to $73 million for the fourth quarter of fiscal 2013. Operating income as a percentage of Net sales increased approximately 260 basis points during the fourth quarter of fiscal 2014, as compared to the fourth quarter of fiscal 2013.
Adjusted EBITDA increased $25 million, or 17 percent, to $172 million for the fourth quarter of fiscal 2014, compared to $147 million for the fourth quarter of fiscal 2013. Adjusted EBITDA as a percentage of Net sales increased approximately 70 basis points to 9 percent in the fourth quarter of fiscal 2014, as compared to 8 percent in the fourth quarter of fiscal 2013.
Net loss for the fourth quarter of fiscal 2014 was $93 million, which included a $106 million loss on extinguishment and modification of debt. Net loss for the fourth quarter of fiscal 2013 was $66 million, which included a $12 million restructuring charge. Net loss per diluted share was $0.48 in the fourth quarter of fiscal 2014, as compared to $0.34 in the fourth quarter of fiscal 2013.
Adjusted net income increased to $23 million for the fourth quarter of fiscal 2014, as compared to Adjusted net loss of $4 million for the fourth quarter of fiscal 2013. The increase in Adjusted net income is attributable to sales growth, the leverage of fixed costs through sales volume increases, and the reduction in depreciation and amortization expense. Adjusted net income per diluted share was $0.11 in the fourth quarter of fiscal 2014, as compared to Adjusted net loss per diluted share of $0.02 in the fourth quarter of fiscal 2013.
Business Unit Performance
Facilities Maintenance
Full-Year Results
Net sales increased $179 million, or 8 percent, to $2.5 billion in the full-year fiscal 2014, as compared to $2.3 billion for the full-year fiscal 2013. Adjusted EBITDA increased $57 million, or 13 percent, to $491 million for the full-year fiscal 2014 as compared to $434 million for the full-year fiscal 2013. Adjusted EBITDA as a percentage of Net sales increased approximately 100 basis points for the full-year of fiscal 2014, as compared to the full-year fiscal 2013.
Fourth-Quarter Results
Net sales increased $38 million, or 7 percent, to $560 million in the fourth quarter of fiscal 2014 as compared to $522 million in the fourth quarter of fiscal 2013. Adjusted EBITDA increased $14 million, or 16 percent, to $104 million during the fourth quarter of fiscal 2014 as compared to $90 million in the fourth quarter of fiscal 2013. Adjusted EBITDA as a percentage of Net sales increased approximately 140 basis points in the fourth quarter of fiscal 2014 as compared to the fourth quarter of fiscal 2013.
Waterworks
Full-Year Results
Net sales increased $200 million, or 9 percent, to $2.4 billion in the full-year of fiscal 2014 as compared to $2.2 billion in the full-year of fiscal 2013. Adjusted EBITDA increased $25 million, or 14 percent, to $198 million during the full-year of fiscal 2014 as compared to $173 million in the full-year of fiscal 2013. Adjusted EBITDA as a percentage of Net sales increased approximately 40 basis points in the full-year of fiscal 2014 as compared to the full-year of fiscal 2013.
Fourth-Quarter Results
Net sales increased $46 million, or 10 percent, to $516 million in the fourth quarter of fiscal 2014 as compared to $470 million in the fourth quarter of fiscal 2013. Adjusted EBITDA increased $6 million, or 20 percent, to $36 million during the fourth quarter of fiscal 2014 as compared to $30 million in the fourth quarter of fiscal 2013. Adjusted EBITDA as a percentage of Net sales increased approximately 60 basis points in the fourth quarter of fiscal 2014 as compared to the fourth quarter of fiscal 2013.
Power Solutions
Full-Year Results
Net sales increased $70 million, or 4 percent, to $1.9 billion in the full-year of fiscal 2014 as compared to $1.8 billion in the full-year of fiscal 2013. Adjusted EBITDA increased $3 million, or 4 percent, to $79 million during the full-year of fiscal 2014 as compared to $76 million in the full-year of fiscal 2013. Adjusted EBITDA as a percentage of Net sales in the full-year of fiscal 2014 was comparable to the full-year of fiscal 2013.
Fourth-Quarter Results
Net sales increased $9 million, or 2 percent, to $462 million in the fourth quarter of fiscal 2014 as compared to $453 million in the fourth quarter of fiscal 2013. Net sales in fiscal 2014 were negatively impacted by $5 million of unfavorable Canadian exchange rate changes. Adjusted EBITDA decreased $2 million, or 11 percent, to $17 million during the fourth quarter of fiscal 2014 as compared to $19 million in the fourth quarter of fiscal 2013. Adjusted EBITDA as a percentage of Net sales decreased approximately 50 basis points in the fourth quarter of fiscal 2014 as compared to the fourth quarter of fiscal 2013.
Construction & Industrial – White Cap
Full-Year Results
Net sales increased $188 million, or 15 percent, to $1.5 billion in the full-year of fiscal 2014 as compared to $1.3 billion in the full-year of fiscal 2013. Adjusted EBITDA increased $32 million, or 41 percent, to $111 million during the full-year of fiscal 2014 as compared to $79 million in the full-year of fiscal 2013. Adjusted EBITDA as a percentage of Net sales increased approximately 140 basis points in the full-year of fiscal 2014 as compared to the full-year of fiscal 2013.
Fourth-Quarter Results
Net sales increased $42 million, or 14 percent, to $337 million in the fourth quarter of fiscal 2014 as compared to $295 million in the fourth quarter of fiscal 2013. Adjusted EBITDA increased $7 million, or 50 percent, to $21 million during the fourth quarter of fiscal 2014 as compared to $14 million in the fourth quarter of fiscal 2013. Adjusted EBITDA as a percentage of Net sales increased approximately 150 basis points in the fourth quarter of fiscal 2014 as compared to the fourth quarter of fiscal 2013.
Refinancing Activities
In December 2014, HD Supply refinanced its $1.25 billion, 8.125% first-lien senior secured notes due 2019, with new $1.25 billion, 5.25%, first-lien senior secured notes due 2021, which is a two and one half year extension of maturity from the old notes. As a result of the interest rate reduction of approximately 300 basis points, the company expects to save approximately $36 million annually in pre-tax cash interest, representing $0.18 per diluted share on an annual basis.
Settlement of Tax Audit
On February 19, 2015, the company received a notification advising that the tentative settlement reached in the third quarter of fiscal 2014, related to the company’s U.S. federal income tax returns filed for the tax years ended February 3, 2008 and February 1, 2009, was approved by the Joint Committee on Taxation. As a result of the approval and finalization of the tentative settlement, the tax years ending February 3, 2008 and February 1, 2009 are settled and closed to any further adjustments. The results of such approval and finalization of the tentative settlement will be reflected in the company’s first quarter of fiscal 2015 results.
Fourth-Quarter Monthly Sales Performance
Net sales for November, December and January were $648 million, $587 million and $770 million, respectively. There were 18 selling days in November, 19 selling days in December and 24 selling days in January. Average year-over-year daily sales growth for November, December and January were 6.3 percent, 5.9 percent and 8.8 percent, respectively.
Preliminary Sales Results
Preliminary Net sales in February were $630 million. There were 20 selling days in February and average daily sales were up 6.6 percent versus prior year. Preliminary February year-over-year average daily sales growth by business was Facilities Maintenance 2.9 percent, Waterworks 3.3 percent, Power Solutions 13.2 percent, and Construction & Industrial – White Cap 14.8 percent.
“February sales were impacted by persistent winter weather conditions resulting in certain branch and distribution center closures across the country in the second half of the month. We are committed to providing a safe work environment at HD Supply,” added DeAngelo. “Given continued adverse weather in March, we have yet to see improvement in our construction related businesses, but we will continue to focus on controllable execution as we enter our spring selling season.”
Fiscal Year 2015 and First-Quarter 2015 Outlook
For fiscal year 2015, the company estimates end market growth of approximately 3 to 4%, which includes a potential negative incremental impact to its end market growth estimate of between 50 to 150 basis points to sales in fiscal year 2015 due to the current weakness in the Oil and Gas end markets. The company estimates 300 basis points of sales growth in excess of the estimated market growth and operating leverage in the range of 1.5 to 2.0 times for fiscal year 2015.
For first quarter 2015, the company anticipates Net sales to be in the range of $2,175 million to $2,230 million, Adjusted EBITDA in the range of $195 million to $207 million, and Adjusted net income per diluted share in the range of $0.25 to $0.31. The first quarter 2015 Adjusted net income per diluted share range assumes a fully diluted weighted average share count of 201 million.
The company will provide further specifics on the first quarter and fiscal year 2015 outlook during the fiscal 2014 full-year and fourth quarter earnings conference call and in the earnings call presentation materials.
Fiscal 2014 Fourth-Quarter and Full-Year Conference Call
As previously announced, HD Supply will hold a conference call on Tuesday, March 24, 2015 at 8:00 a.m. (Eastern Time) to discuss its fourth quarter and full-year fiscal 2014 results. The conference call and presentation materials can be accessed via webcast by logging on from the Investor Relations section of the company’s Web site at hdsupply.com. The online replay will remain available for a limited time following the call.
Non-GAAP Financial Measures
HD Supply supplements its reporting of net income (loss) with non-GAAP measurements, including Adjusted EBITDA, Adjusted net income (loss) and Adjusted net income (loss) per share. This supplemental information should not be considered in isolation or as a substitute for the GAAP measurements. Additional information regarding Adjusted EBITDA, Adjusted net income (loss) and Adjusted net income (loss) per share referred to in this press release is included below under “Reconciliation of Non-GAAP Measures.”


Reconciliation of Non-GAAP Measures
We present Adjusted EBITDA because it is a primary measure used by management to evaluate operating performance. We believe the presentation of Adjusted EBITDA enhances investors’ overall understanding of the financial performance of our business. Adjusted EBITDA is not a recognized term under GAAP and does not purport to be an alternative to Net income (loss) as a measure of operating performance. In addition, we present Adjusted net income (loss) to measure our overall profitability as we believe it is an important measure of our performance. Adjusted net income (loss) is not a recognized term under GAAP and does not purport to be an alternative to Net income (loss) as a measure of operating performance. Adjusted net income (loss) is defined as Net income (loss) less Income (loss) from discontinued operations, net of tax, further adjusted for certain non-cash, non-recurring or unusual items, net of tax. We compensate for the limitations of using non-GAAP financial measures by using them to supplement GAAP results to provide a more complete understanding of the factors and trends affecting the business than GAAP results alone. Because not all companies use identical calculations, our presentation of Adjusted EBITDA and Adjusted net income (loss) may not be comparable to other similarly titled measures of other companies.
Adjusted EBITDA is based on “Consolidated EBITDA,” a measure which is defined in our senior credit facilities and used in calculating financial ratios in several material debt covenants. Adjusted EBITDA is defined as Net income (loss) less Income (loss) from discontinued operations, net of tax, plus (i) Interest expense and Interest income, net, (ii) Provision (benefit) for income taxes, (iii) depreciation and amortization and further adjusted to exclude non-cash items and certain other adjustments to Consolidated Net Income permitted in calculating Consolidated EBITDA under our senior credit facilities.
No reconciliation of the forecasted range for Adjusted EBITDA to Net income and Adjusted net income per diluted share to Net income per diluted share for the first quarter of fiscal 2015 is included in this press release because we are unable to quantify certain amounts that would be required to be included in the GAAP measure without unreasonable efforts. In addition, the company believes such reconciliations would imply a degree of precision that would be confusing or misleading to investors.
Adjusted EBITDA and Adjusted net income (loss) have limitations as analytical tools and should not be considered in isolation or as substitutes for analyzing our results as reported under GAAP. Some of these limitations are:
- Adjusted EBITDA and Adjusted net income (loss) do not reflect changes in, or cash requirements for, our working capital needs;
- Adjusted EBITDA does not reflect our interest expense, or the requirements necessary to service interest or principal payments on our debt;
- Adjusted EBITDA does not reflect our income tax expenses or the cash requirements to pay our taxes;
- Adjusted EBITDA and Adjusted net income (loss) do not reflect historical cash expenditures or future requirements for capital expenditures or contractual commitments; and
- although depreciation and amortization charges are non-cash charges, the assets being depreciated and amortized will often have to be replaced in the future, and Adjusted EBITDA does not reflect any cash requirements for such replacements.


Tagged with HD Supply, tED