






The U.S. Bureau of Labor Statistics today released the Producer Price Index for July, 2026.
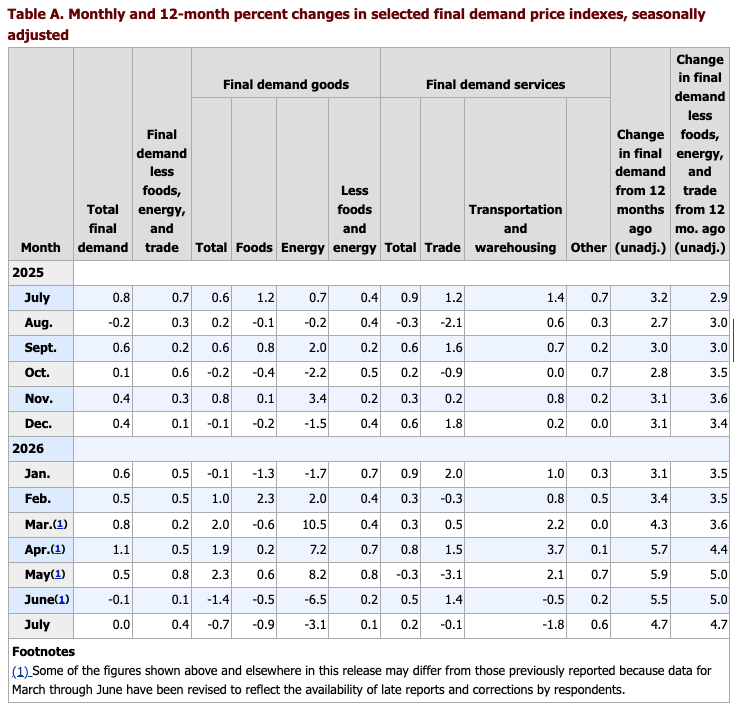
The Producer Price Index for final demand was unchanged in July, seasonally adjusted. Final demand prices edged down 0.1 percent in June and rose 0.5 percent in May. (See table A.) On an unadjusted basis, the index for final demand increased 4.7 percent for the 12 months ended in July.
In July, a 0.2-percent increase in the index for final demand services and a 2.2-percent advance in prices for final demand construction offset a 0.7-percent decrease in the index for final demand goods.
Prices for final demand less foods, energy, and trade services rose 0.4 percent in July after inching up 0.1 percent in June. For the 12 months ended in July, the index for final demand less foods, energy, and trade services advanced 4.7 percent.
Final Demand
Final demand services: Prices for final demand services advanced 0.2 percent in July after rising 0.5 percent in June. The July increase can be traced to the index for final demand services less trade, transportation, and warehousing, which moved up 0.6 percent. Conversely, the indexes for final demand transportation and warehousing services and for final demand trade services decreased 1.8 percent and 0.1 percent, respectively.
Product detail: Leading the July increase in prices for final demand services, the index for portfolio management advanced 6.5 percent. Margins for health, beauty, and optical goods retailing; automobiles and automobile parts retailing; lawn, garden, and farm equipment and supplies retailing; food and alcohol retailing; and food and alcohol wholesaling also moved higher. In contrast, prices for truck transportation of freight fell 1.8 percent. The indexes for machinery and vehicle wholesaling and for securities brokerage, dealing, and investment advice also decreased. (See table 2.)
Final demand goods: The index for final demand goods fell 0.7 percent in July after moving down 1.4 percent in June. A major factor in the July decrease was a 3.1-percent decline in prices for final demand energy. The index for final demand foods moved down 0.9 percent. Conversely, prices for final demand goods less foods and energy increased 0.1 percent.
Product detail: More than half of the July decrease in the index for final demand goods can be attributed to a 5.7-percent decline in prices for gasoline. The indexes for fresh and dry vegetables, diesel fuel, jet fuel, residual fuels, and thermoplastic resins and materials also fell. In contrast, prices for motor vehicles and equipment moved up 0.3 percent. The indexes for electric power and for grains also increased.
Intermediate Demand by Commodity Type
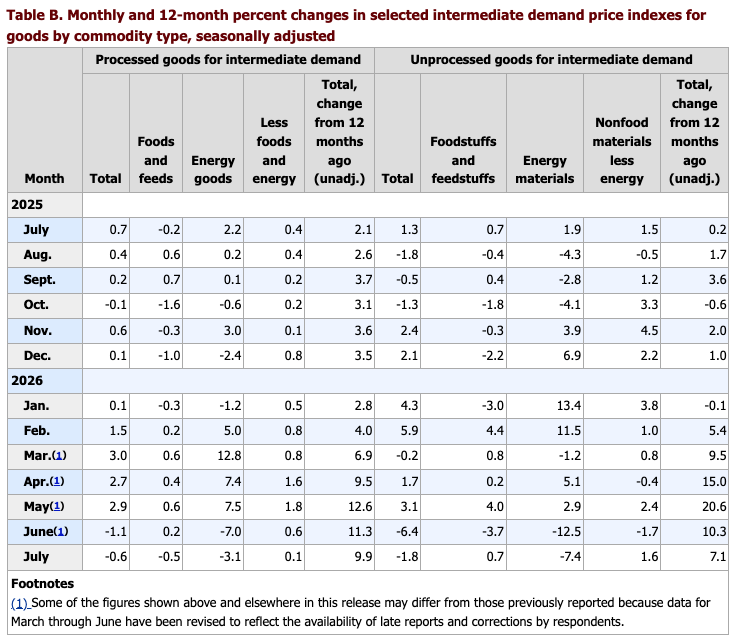
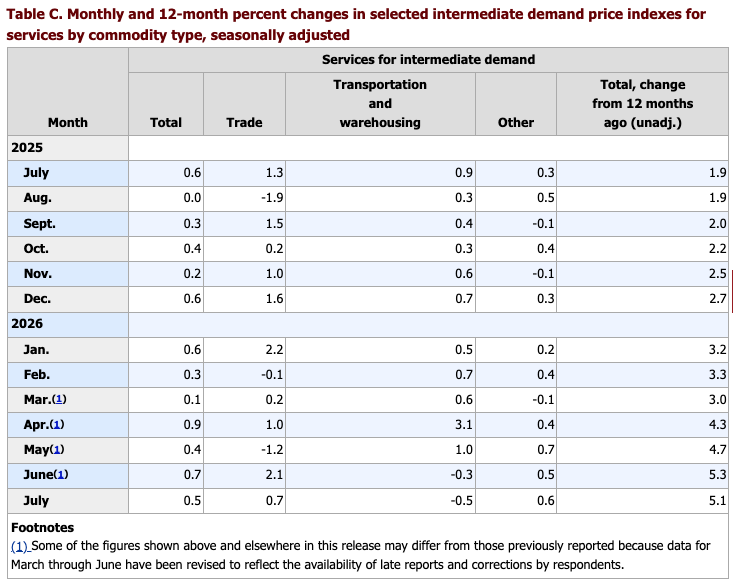
Within intermediate demand in July, the index for processed goods declined 0.6 percent, prices for unprocessed goods fell 1.8 percent, and the index for services rose 0.5 percent. (See tables B and C.)
Processed goods for intermediate demand: The index for processed goods for intermediate demand moved down 0.6 percent in July after decreasing 1.1 percent in June. Leading the decline in July, prices for processed energy goods fell 3.1 percent. The index for processed foods and feeds decreased 0.5 percent. Conversely, prices for processed materials less foods and energy edged up 0.1 percent. For the 12 months ended in July, the index for processed goods for intermediate demand rose 9.9 percent.
Product detail: Over half of the July decrease in the index for processed goods for intermediate demand can be traced to prices for diesel fuel, which moved down 6.7 percent. The indexes for jet fuel, basic organic chemicals, gasoline, thermoplastic resins and materials, and meats also fell. In contrast, prices for lumber increased 5.0 percent. The indexes for lubricating oil base stocks and for commercial electric power also moved higher.
Unprocessed goods for intermediate demand: Prices for unprocessed goods for intermediate demand declined 1.8 percent in July after falling 6.4 percent in June. The July decrease can be attributed to the index for unprocessed energy materials, which dropped 7.4 percent. Conversely, prices for unprocessed nonfood materials less energy and for unprocessed foodstuffs and feedstuffs moved up 1.6 percent and 0.7 percent, respectively. For the 12 months ended in July, the index for unprocessed goods for intermediate demand increased 7.1 percent.
Product detail: Leading the July decline in prices for unprocessed goods for intermediate demand, the index for crude petroleum fell 11.9 percent. Prices for fresh vegetables (except potatoes), nonferrous metal ores, slaughter steers and heifers, raw milk, and slaughter hogs also moved lower. In contrast, the index for aluminum base scrap increased 5.8 percent. Prices for grains and for natural gas also advanced.
Services for intermediate demand: The index for services for intermediate demand rose 0.5 percent in July following a 0.7-percent increase in June. Most of the July advance can be traced to prices for services less trade, transportation, and warehousing for intermediate demand, which moved up 0.6 percent. Margins for trade services for intermediate demand rose 0.7 percent. Conversely, the index for transportation and warehousing services for intermediate demand fell 0.5 percent. For the 12 months ended in July, prices for services for intermediate demand increased 5.1 percent.
Product detail: Over one-third of the July advance in the index for services for intermediate demand is attributable to prices for portfolio management, which rose 6.5 percent. The indexes for internet advertising sales, food and alcohol wholesaling, management consulting services, machinery and equipment parts and supplies wholesaling, and the U.S. Postal Service also moved higher. In contrast, prices for truck transportation of freight decreased 1.8 percent. The indexes for business loans (partial) and for building materials, paint, and hardware wholesaling also declined.
Intermediate Demand by Production Flow
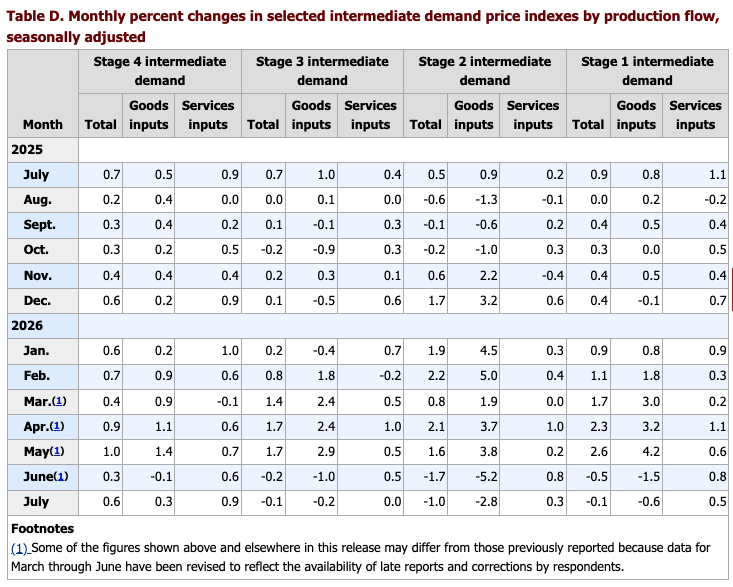
Stage 4 intermediate demand: Prices for stage 4 intermediate demand increased 0.6 percent in July after moving up 0.3 percent in June. In July, the index for total services inputs to stage 4 intermediate demand rose 0.9 percent, and prices for total goods inputs advanced 0.3 percent. (See table D.) Increases in the indexes for portfolio management; machinery and equipment parts and supplies wholesaling; food and alcohol wholesaling; management consulting services; metals, minerals, and ores wholesaling; and grains outweighed falling prices for gasoline, diesel fuel, and gross rents for retail properties. For the 12 months ended in July, the index for stage 4 intermediate demand rose 6.7 percent.
Stage 3 intermediate demand: Prices for stage 3 intermediate demand edged down 0.1 percent in July following a 0.2-percent decline in June. In July, the index for total goods inputs to stage 3 intermediate demand decreased 0.2 percent, while prices for total services inputs were unchanged. Declines in the indexes for diesel fuel, basic organic chemicals, slaughter steers and heifers, raw milk, and business loans (partial) outweighed advances in prices for grains; the U.S. Postal Service; management consulting services; and hay, hayseeds, and oilseeds. For the 12 months ended in July, the index for stage 3 intermediate demand increased 5.8 percent.
Stage 2 intermediate demand: The index for stage 2 intermediate demand fell 1.0 percent in July after declining 1.7 percent in June. In July, prices for total goods inputs to stage 2 intermediate demand dropped 2.8 percent. Conversely, the index for total services inputs rose 0.3 percent. Decreasing prices for crude petroleum, thermoplastic resins and materials, business loans (partial), natural gas liquids, diesel fuel, and jet fuel outweighed advances in the indexes for internet advertising sales; natural gas; and hay, hayseeds, and oilseeds. For the 12 months ended in July, prices for stage 2 intermediate demand moved up 7.6 percent.
Stage 1 intermediate demand: The index for stage 1 intermediate demand inched down 0.1 percent in July following a 0.5-percent decline in June. In July, prices for total goods inputs to stage 1 intermediate demand fell 0.6 percent. In contrast, the index for total services inputs increased 0.5 percent. Decreases in prices for basic organic chemicals, diesel fuel, primary nonferrous metals, gasoline, and truck transportation of freight outweighed advances in the indexes for portfolio management, grains, aluminum base scrap, and internet advertising sales. For the 12 months ended in July, prices for stage 1 intermediate demand rose 9.7 percent.
The full report and technical notes can be found here.
Tagged with Bureau of Labor Statistics, economy