


PARIS — Rexel S.A. today reported second-quarter sales and half-year 2019 results.
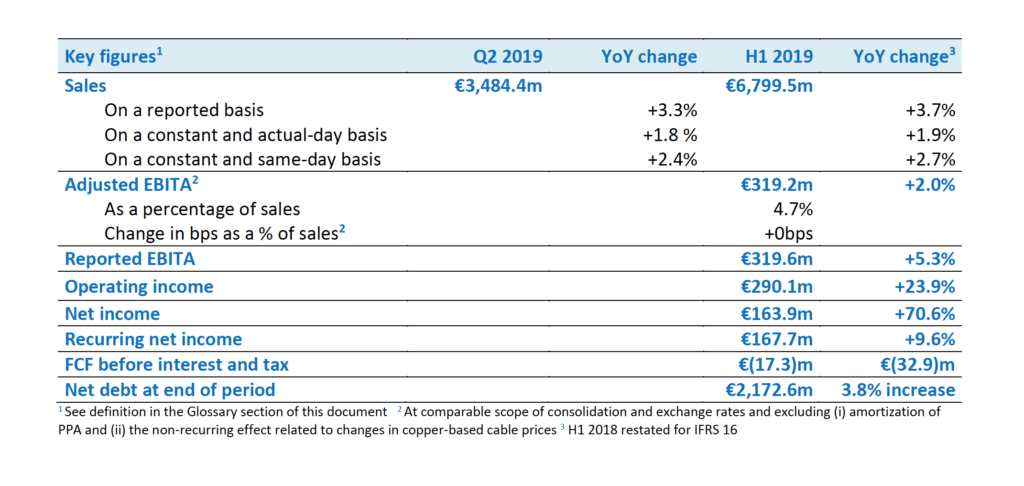
→ SALES OF €3.484bn IN Q2
- On a constant and same-day basis, sales up 2.4%, of which:
- Europe: -0.9%, or up +1.7% excluding branch closures in Germany and Spain
- North America: +6.8%, driven by project business in the U.S. and Canada
- Asia-Pacific: +3.4% or up +4.5% restated for the impact of the disposal in Australia
- Organic actual-day growth of 1.8%, including -0.6% from calendar and -0.2% from copper
- Reported sales growth of 3.3%, including currency (+1.8 %) and scope (-0.3%) effects
→ ADJUSTED EBITA UP 2.0% IN H1 2019, DESPITE UNFAVORABLE CALENDAR EFFECTS TO BE REVERSED IN H2
→ NET INCOME UP 70.6% IN H1 2019 AND RECURRING NET INCOME UP 9.6%
→ FULL YEAR GUIDANCE CONFIRMED
Patrick Berard, Chief Executive Officer, stated: “I am pleased with Rexel’s solid first-half performance, with continued organic sales growth in most key markets and profitability growth according to plan. This marks the 11th consecutive quarter of improved organic sales, demonstrating that Rexel has returned to sustainable growth.
“Rexel also showed in the first half of the year its regained capacity to adjust rapidly to adverse conditions both in the macro-economic environment and in specific markets.
“This improved operational flexibility makes me confident in our ability to deliver our 2019 targets, with the company increasingly focused on operating leverage and continuing its digital transformation journey.”
SALES
In Q2, sales were up 3.3% year-on-year on a reported basis and up 2.4% on a constant and same-day basis, reflecting sales momentum in the US, China and key European countries.
In the second quarter, Rexel posted sales of €3,484.4 million (USD $3,884.41 million), up 3.3% on a reported basis, including:
- A positive currency effect of €61.9 million (USD $69.01 million) (i.e. +1.8% of Q2 2018 sales), mainly due to the appreciation of the US dollar against the euro,
- A negative net scope effect of €11.2 million (USD $12.49 million) (i.e. -0.3% of Q2 2018 sales), resulting from divestments in China,
- A negative calendar effect of 0.6 percentage points.
On a constant and same-day basis, sales were up 2.4%, including a negative effect from the change in copper-based cable prices (-0.2% in Q2 19 vs +0.7% in Q2 18).
In H1 2019, Rexel posted sales of €6,799.5 million (USD $7,580.08 million), up 3.7% on a reported basis. On a constant and same-day basis, sales were up 2.7%, including a negative impact of 0.3% from the change in copper-based cable prices.
The 3.7% increase in sales on a reported basis included:
- A positive currency effect of €138.0 million (USD $153.84 million) (i.e. +2.1% of H1 2018 sales), mainly due to the appreciation of the US dollar against the euro,
- A negative net scope effect of €23.3 million (USD $25.97 million) (i.e. -0.4% of H1 2018 sales), resulting from 2018 divestments in China.
- A negative calendar effect of 0.8 percentage points.
Europe (52% of Group sales): -0.9% in Q2 and -0.2% in H1 on a constant and same-day basis.
In the second quarter, sales in Europe decreased by 1.5% on a reported basis, with non-material currency and scope effects. On a constant and same-day basis, sales were down 0.9% (or up 1.7% excluding branch closures in Germany and Spain).
- Sales in France (38% of the region’s sales) were up 2.6%, on a challenging base effect, supported by good momentum in our commercial projects, residential and specialty (HVAC) businesses;
- Sales in Scandinavia (13% of the region’s sales) were up 1.7%, with positive momentum in Sweden, up +5.0% thanks to large C&I business more than offsetting negative momentum in residential. Norway was down 3.5% and Finland flat;
- Benelux (11% of the region’s sales) posted solid +12.1% growth, with good momentum in Belgium, up +10.3%, notably thanks to photovoltaic sales (+2.0% contribution) and the acquisition in July 2018 of a branch in the Courtrai area (+2.3% contribution); The Netherlands were up 14.6%;
- In the UK (10% of the region’s sales), sales dropped by 8.2%, as a result of business selectivity (-7.6%impact) and branch closures (-2.4% impact – 30 branch closures of which 13 in 2019);
- Sales in Germany (9% of the region’s sales) were down 21.7%, reflecting the transformation of the country’s business to refocus on profitable activities (industrial segment on a national basis and C&I in the southern part of the country). Excluding the closure of 17 branches, same-day sales were broadly flat;
- Sales in Switzerland (6% of the region’s sales) grew by 1.6% in a project environment that remains competitive.
North America (39% of Group sales): +6.8% in Q2 and +7.6% in H1 on a constant and same-day basis.
In the second quarter, sales in North America were up 12.1% on a reported basis, including a positive currency effect of €63.8m (USD $71.12m) (mainly due to the appreciation of the US dollar against the euro). On a constant and same-day basis, sales were up 6.8%, driven by the US and Canada.
- In the US (79% of the region’s sales), sales grew 7.0% on more difficult base effect, confirming our ability to capture market growth and gain market share in specific regions.
- Commercial and residential business are progressing in high single digits in the quarter
- Industrial business is slowing on lower end-market demand and a tough comparable base.
- Good contribution from past investment in sales reps, branch openings and refresh of existing branches
- Investment in people: +5% compared to last year
- Investment in branch openings:
- 54 new branches/counters since 2017, including 6 in H1 2019, contributing for + 1.0% of sales growth;
- 29% of the existing network has been refreshed since 2016.
- In Canada (21% of the region’s sales), sales were up 6.3% on a same-day basis, mainly driven by strong demand from industry end-users and initiatives in our proximity business (harmonization of our core offer plan across the country).
Asia-Pacific (9% of Group sales): +3.4% in Q2 and +0.8% in H1 on a constant and same-day basis.
In the second quarter, sales in Asia-Pacific were down 2.2% on a reported basis, including a negative scope effect of €11.2m (USD $12.49m) following the disposal of our business in China and a negative currency effect of €2.3m (USD $2.56m), mainly due to the depreciation of the Australian dollar against the euro. On a constant and same-day basis, sales were up 3.4% (or +4.5% excluding the disposal effect of part of our industrial business in Australia at the end of April 2018).
- In the Pacific (50% of the region’s sales), sales were stable on a constant and same-day basis. In Australia (81% of Pacific’s sales), sales were down 0.5% or +2.1% excluding asset disposal, outperforming the market. While residential and commercial markets are slowing down, our business benefited from positive momentum from infrastructure and mining spending (capex and MRO).
- In Asia (50% of the region’s sales), sales were up 7.0%:
- In China (85% of Asia), sales grew by 10.1%, driven by a large contract (10.6 million euros) that contributed positively since early 2019. The refocusing on promising markets is ongoing and is showing positive signs.
- Middle East is down 41.3%, impacted by a large project that benefited Q2 2018 (+6.7 million euros)
PROFITABILITY
Adjusted EBITA margin at 4.7% in H1 2019, stable compared to H1 2018.
In the first half, gross margin was up 11 bps year-on-year, at 25.0% of sales, and opex (including depreciation) amounted to 20.3% of sales, representing a deterioration of 11 bps year-on-year.
- In Europe, gross margin stood at 27.4% of sales, up 32bps year-on-year thanks to France and the reprofiling of the German business. In the first half, opex (including depreciation) deteriorated by 23bps to 21.4% of sales, mainly due to investments and cost inflation that will be offset by productivity gains;
- In North America, gross margin stood at 23.1% of sales. This represented a 4bps improvement year-on-year, mainly thanks to our past initiatives and the improvement in service level, partially offset by a lag in passing on tariff increases. Opex (including depreciation) improved slightly (+4bp year-on-year) at 19.0% of sales, as volume effect more than offset higher wages and freight costs, as well as investments in people;
- In Asia-Pacific, gross margin stood at 18.3% of sales, a deterioration of 29bps year-on-year, and opex (including depreciation) deteriorated by 41bps, notably due to the disposal of our Rockwell business in Australia in April 2018. Opex was also impacted by wage inflation in China and India;
- At corporate level, opex amounted to €12.9 million (USD $14.38 million), compared to €13.0 million (USD $14.49 million) a year ago with investment in IT & Digital offset by lower corporate costs.
As a result, adjusted EBITA stood at €319.2m (USD $355.84m), up 2.0% in the first half 2019.
Adjusted EBITA margin was flat at 4.7% of sales, reflecting:
- an improved adjusted EBITA margin in Europe at 5.9% of sales, up 9bps;
- an improved adjusted EBITA margin in North America at 4.1% of sales, up 8bps and
- a lower adjusted EBITA margin in Asia-Pacific at 1.7% of sales, down 69bps.
In H1 19, reported EBITA stood at €319.6 million (USD $356.29 million) (including a positive one-off copper effect of €0.4million or USD $0.45million), up 5.3% year-on-year.
NET INCOME
Net income of €163.9m (USD $182.72m)in H1 2019, up 70.6%.
Recurring net income up 9.6% to €167.7 million (USD $186.95 million) in H1 2019.
Operating income in the first half stood at €290.1 million (USD $323.40 million) vs. €234.1 million (USD $260.97 million) in H1 2018.
- Amortization of intangible assets resulting from purchase price allocation amounted to €7.1 million (USD $7.92 million) (vs.€8.3 million–or USD $9.25 million– in H1 2018);
- Other income and expenses amounted to a net charge of €22.4 million (USD $24.97 million) (vs. a net charge of €61.1 million–or USD $68.11 million–in H1 2018). They included €13.5 million (USD $15.05 million) of restructuring costs (vs. €59.0 million–or USD $65.77 million–in H1 2018). They also included a charge of €9.3 million (USD $10.37 million) from intangible asset impairment in Finland.
Net financial expenses in the first half amounted to €93.6 million (USD $104.35 million) (vs. €72.5 million–USD $80.82 million–in H1 2018).
Excluding a €20.8m (USD $23.19m) one-off expense (of which a €16.9 million–USD $18.84 million–redemption premium) recognized in the first half of 2019 related to the cost of the early repayment of the €650 million (USD $724.62 million) senior notes due 2023, net financial expenses were stable, with effective interest rate unchanged at 2.81% in H1 2019 (vs. 2.84% in H1 2018).
Income tax in the first half represented a charge of €32.6 million (USD $36.34 million) (vs. €65.5 million–USD $73.02 million–in H1 2018 restated for IFRS 16), reflecting a decrease in the tax rate (16.6% vs 40.5% in H1 2018), thanks to the release of a tax exposure provision of €29.5m (USD $32.89m).
Net income in the first half is up 70.6% to €163.9 million (USD $182.72 million) (vs. €96.1 million–USD $107.31–in H1 2018).
Recurring net income in the first half amounted to €167.7 million (USD $186.95 million), up 9.6% compared to H1 2018.
FINANCIAL STRUCTURE
Outflow of free cash-flow before interest and tax of €17.3 million (USD $17.3 million) in first half 2019.
Indebtedness ratio of 2.86x at June 30, 2019.
In the first half, free cash flow before interest and tax was an outflow of €17.3 million (USD $19.29 million) (vs. an inflow of €15.6 million–USD $17.39 million–in H1 2018). This net outflow included:
- Higher cash outflow from restructuring (€28.7m vs. €18.8m in H1 2018) (USD $31.99m vs. $20.96m in H1 2018), with the execution of the turnaround plans in Germany and Spain.
- An outflow of €270.5 million (USD $301.55 million) from change in working capital (vs. an outflow of €249.1 million–$277.70 million–in H1 2018), mainly due to payables.
- Higher capital expenditure (€53.5 million vs. €30.2 million in H1 2018) (USD $59.64 million vs. $33.67 million in H1 2018), as H1 2018 benefited from the disposal of our Rockwell automation business in Australia. Gross capital expenditure stood at €55.9 million (USD $62.32 million) in H1 2019 compared to €48.5m (USD $54.07m) in H1 2018;
At June 30, 2019, net debt stood at €2,172.6 million (USD $2,422.01 million), up 3.8% year-on-year (vs. €2,093.7 million–USD $2,334.06 million–at June 30, 2018). It took into account:
- €44.4 million (USD $49.50 million) of net interest paid in H1 2019 (vs €41.3 million–USD $46.04 million–paid in H1 2018),
- €62.5 million (USD $69.67 million) of income tax paid in the first half compared to €24.0 million (USD $26.76 million) paid in H1 2018, which benefited from a refund of 2017 income tax overpayment in France (€22 million–USD $24.53 million) and of the 3% tax on dividends (€8m–USD $8.92m)
- €20.8m (USD $23.19m) of costs related to the early redemption of the €650m (USD $724.62m) bond maturing in 2023
- €8.4 million (USD $9.36 million) of negative currency effects during the first half (vs a negative effect of €9.7 million–USD $10.81 million–in H1 2018).
At June 30, 2019, the indebtedness ratio (Net financial debt/ EBITDA), as calculated under the Senior Credit Agreement terms, stood at 2.86x vs. 2.91x at June 30, 2018.
STRATEGIC ROADMAP AND OUTLOOK
We are adapting to become more agile in an increasingly volatile environment. Rexel’s operational focus is on improving operating leverage and our strategic priority remains to advance our digital transformation. Combined with a favorable calendar effect in H2, this focus puts us on track to deliver our full year guidance.
Consistent with our medium-term ambition and assuming no material changes in the macroeconomic environment, we target for 2019, at comparable scope of consolidation and exchange rates:
- A 2% to 4% same-day sales growth, excluding an estimated unfavorable impact of 1% from branch closures in Germany and Spain;
- A 5% to 7% increase in adjusted EBITA1;
- A further improvement of the indebtedness ratio (net debt-to-EBITDA 2).