


![]() PARIS, France — Rexel today released its second-quarter sales and half-year 2020 results.
PARIS, France — Rexel today released its second-quarter sales and half-year 2020 results.
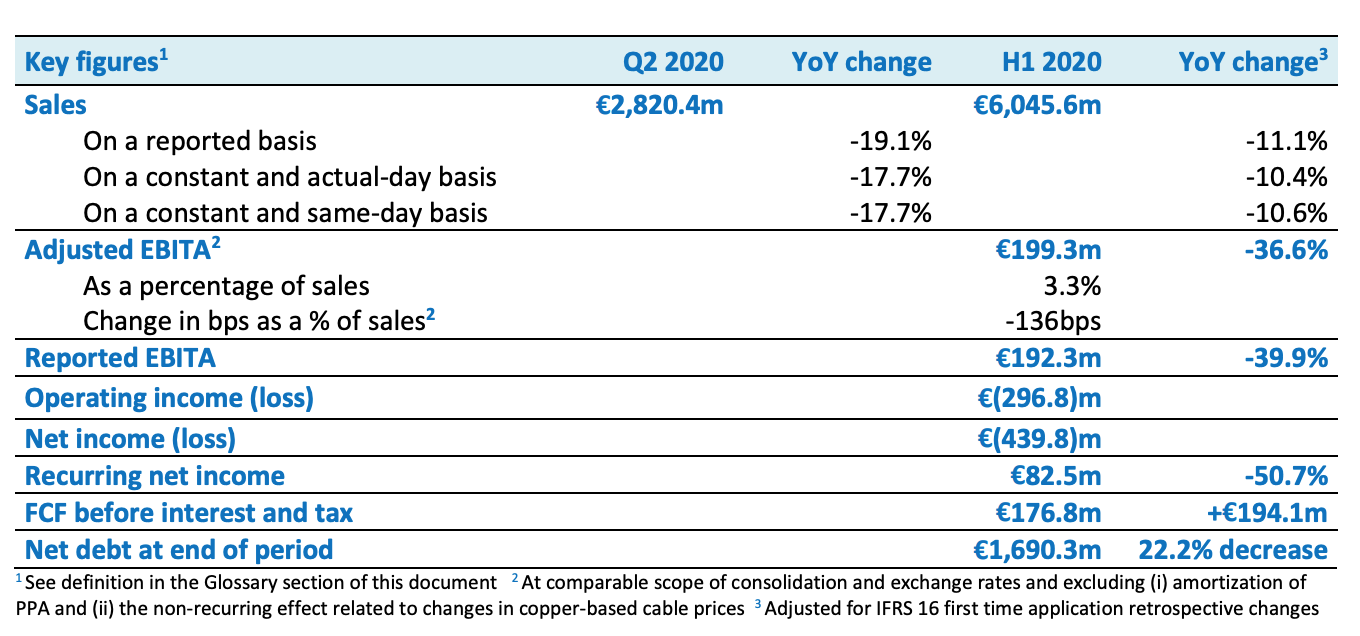
First-Half 2020 Results: Same-day sales down -17.7% in Q2 20, with gradual recovery since April; Active opex management in Q2, without compromising our medium-term digital ambition; Strong FCF generation with a 77.7% conversion rate in H1 2020.
→ SALES OF €2,820.4m [USD $3,308.33m] IN Q2 2020, REFLECTING BUSINESS CONTINUITY TO SERVE OUR CUSTOMERS WHILE PRESERVING THE HEALTH AND SAFETY OF OUR EMPLOYEES
- On a constant and same-day basis, sales down 17.7% in Q2 20. Even as the COVID-19 pandemic spread in most geographies, the dedication of our employees and digital transformation allowed us to gain market share
- Gradual improvement since April, with progressive recovery in Europe and Pacific, while North America is lagging
- Same-day sales down 5.6% in the first 2 weeks of July
→ FOCUS ON PROFITABILITY WITH REAL-TIME ADAPTATION TO EVERY LOCAL SITUATION; SALARY & BENEFITS CUT BY 19.7% IN Q2, MOSTLY THROUGH TEMPORARY MEASURES AND STRUCTURAL ACTIONS
→ SOLID FREE CASH FLOW OF €176.8m [USD $207.39m] IN H1 2020 THANKS TO ACTIVE MANAGEMENT OF INVENTORIES AND RECEIVABLES
→ LOWEST LEVEL OF FINANCIAL NET DEBT SINCE 2008; INDEBTEDNESS RATIO AT 2.59x, LOWER THAN JUNE 30, 2019
→ RECURRING NET INCOME DOWN IN H1 2020 AND NET INCOME AT €(439.8)m [USD ($515.89)m] FOLLOWING A €486m [USD $570.08m] GOODWILL IMPAIRMENT, MAINLY TO REFLECT LOWER VOLUME RELATED TO COVID-19
→ VISIBILITY FOR H2 REMAINS LOW; CONTINUED FOCUS ON CASH GENERATION AND OPEX MANAGEMENT
Patrick Berard, CEO of Rexel, stated: “In the last months, Rexel demonstrated its ability to adapt and respond to a challenging business environment globally. Rexel was able to do so by taking advantage of all the investments it made in its network and digital transformation over the past three years.
“We posted strong positive cash flow and resilient sales and profitability, and the credit goes to our very united and committed teams that acted as one company, sharing best practices across the organization. Our customers have welcomed our multiple initiatives and I also thank them for this trust.
“We are emerging from this crisis as a stronger company committed to continuing on our journey of growth and profitability while focusing on our fundamentals.”
SALES
In Q2, sales were down 19.1% year-on-year on a reported basis and down 17.7% on a constant and same-day basis, reflecting the impact of the lockdown in all geographies, with a gradual recovery since mid-April
In the second quarter, Rexel posted sales of €2,820.4 million [USD $3,308.33m], down 19.1% on a reported basis, including:
- A positive currency effect of €6.0 million [USD $7.04m] (i.e. +0.2% of Q2 2019 sales), mainly due to the appreciation of the US dollar against the euro;
- A negative net scope effect of €65.0 million [USD $76.25m] (i.e. -1.9% of Q2 2019 sales), mainly resulting from the disposal of Gexpro Services in the US;
- A neutral calendar effect.
On a constant and same-day basis, sales were down 17.7%, including a negative effect from the change in copper-based cable prices (-0.7% in Q2 20 vs -0.2% in Q2 19).
In H1 2020, Rexel posted sales of €6,045.6 million [USD $7,091.49 million], down 11.1% on a reported basis. On a constant and same-day basis, sales were down 10.6%, including a negative impact of 0.5% from the change in copper-based cable prices.
A strong online performance, as illustrated by the 7.2% increase in digital sales in the first half, allowed us to contain the drop in total H1 same-day sales to -10.6%. Digital sales reached almost 21% of sales at Group level in and represented 31% of sales in Europe.
The 11.1% decrease in sales on a reported basis included:
- A positive currency effect of €35.8 million [USD $41.99 million]( (i.e. +0.5% of H1 2019 sales), mainly due to the appreciation of the US dollar against the euro;
- A negative net scope effect of €85.5 million [USD $100.29 million] (i.e. -1.3% of H1 2019 sales), mainly resulting from the disposal of Gexpro Services in the US;
- A positive calendar effect of 0.2 percentage points.
Europe (54% of Group sales): -16.7% in Q2 and -9.1% in H1 on a constant and same-day basis
In the second quarter, sales in Europe decreased by 16.9% on a reported basis, with non-material currency and scope effects. On a constant and same-day basis, sales were down 16.7% as a result of lockdown policies followed by gradual deconfinement since May.
- Sales in France (34% of the region’s sales) were down 25.2%, mainly as a result of the lockdown from March 17th to May 11th. Sales dropped up to -64% in the last week of March before gradually recovering, mainly as a result of positive momentum in the residential and industrial end-markets. Commercial business lagged in the recovery phase, mainly due to sanitary measures in large projects and lower public spending, partly related to the three-month postponement of municipal elections. The combination of business continuity for our customers and our digital offering translated into market share gains of c. 2 points in the first 6 months of 2020.
- Sales in Scandinavia (16% of the region’s sales) were up 2.3%, supported by good underlying demand from utilities in Finland and Norway, offsetting the lower level of business in Sweden (-2.5%).
- Benelux (12% of the region’s sales) was down 8.1%, mainly due to a 12.7% drop in sales in Belux in Q2 20, impacted by the lockdown, with a gradual recovery since May 11th. Momentum was good in residential business while commercial has lagged. The Netherlands were resilient and benefited from the absence of lockdown measures. Sales were down 1.8%, mainly due to a difficult base effect in the photovoltaic business.
- Sales in Germany (11% of the region’s sales) were up 3.9%, thanks to the limited lockdown measures and our improved sales organization that benefited the construction-related business, while industry continued to suffer from lower export business and lack of demand in the automotive business.
- Sales in Switzerland (8% of the region’s sales) dropped by 6.2%, with better resilience in the Germanic part, which is highly digitalized (above the country penetration rate of 71%).
- In the U.K. (7% of the region’s sales), sales dropped by 41.7%, largely impacted by the lockdown that lasted until beginning of July, coupled with the Brexit effect and, to a lesser extent, branch closures (1.1% impact – 12 branch closures compared to March 2019, including one closure in Q1 2020).
North America (36% of Group sales): -23.0% in Q2 and -14.1% in H1 on a constant and same-day basis
In the second quarter, sales in North America were down 25.5% on a reported basis, including a negative scope effect of 4.6% (-€62.3m) [USD -$73.08m] from the disposal of Gexpro Services and a positive currency effect of 1.4% (+€18.7m) [USD +$21.94m], mainly due to the appreciation of the US dollar against the euro. On a constant and same-day basis, sales dropped by 23.0%.
- In the U.S. (79% of the region’s sales), sales were down 22.8% with a three to four-week lag versus Europe. The Western part of the country (California and Northwest) were the first regions to lock down before gradually recovering. In regions like the Midwest or the Gulf, we anticipate activity to remain depressed in heavy industries (automotive, aerospace) and Oil & Gas. In the Northeast (New York area), the pandemic impact has been significant, and we are adjusting costs and taking the opportunity to adapt the organization. Recovery will largely depend on whether some regions see a second wave of lockdown.
- In Canada (21% of the region’s sales), sales dropped by 23.6% on a same day basis. Sales recovered since mid-May, driven by the Western part of the country, notably helped by more positive Oil & Gas activity (downstream).
Asia-Pacific (10% of Group sales): -0.6% in Q2 and -4.2% in H1 on a constant and same-day basis
In the second quarter, sales in Asia-Pacific were down 3.4% on a reported basis, including a negative currency effect of -3.1% (-€9.3m) [USD -$10.91m], mainly due to the depreciation of the Chinese renminbi and Australian dollar against the euro. On a constant and same-day basis, sales were down 0.6% (or -2.7% excluding the large aerospace contract in China).
- In the Pacific (47% of the region’s sales), sales were down 6.7% on a constant and same-day basis:
- In Australia (86% of Pacific’s sales), sales were down 0.9% with a limited Covid-19 impact until end-May. While we saw good momentum in construction-related business, we faced a difficult base effect in the industrial project business (lower EPC activity).
- In New Zealand (14% of Pacific’s sales), sales dropped by 31.1%, with a complete lockdown leading to a drop in sales of between 63% and 83% in April before gradually recovering.
- In Asia (53% of the region’s sales), sales were up 5.6% on a constant and same-day basis:
- In China (92% of Asia’s sales), sales posted solid 13.9% growth, with a strong recovery in OEM, systems integration and projects (including an aerospace contract that contributed +3.6%)
- In India (which saw a severe lockdown) and the Middle East, sales were down respectively by 55% and 26.8%.
PROFITABILITY
Adjusted EBITA margin at 3.3% in H1 2020, down 136bps compared to H1 2019
In the first half, gross margin was down 36 bps year-on-year, at 24.6% of sales, and opex (including depreciation) amounted to 21.3% of sales, representing a deterioration of 100 bps year-on-year.
- In Europe, gross margin stood at 26.8% of sales, down 60bps year-on-year from negative country mix (mainly France and Germany), customer mix (the Nordics) and lower volume leading to lower rebates. In the first half, opex (including depreciation) represented 22.8% of sales (-133bps), underscoring reactive and agile opex management in Q2 mainly thanks to temporary unemployment measures and other internal efforts;
- In North America, gross margin stood at 22.9% of sales, stable compared to a year ago (+1 bps), showing strong discipline and positive pricing impact. Excellent opex management (-75bps at 19.7%) thanks to decisive actions on Salary & Benefits (S&B reduced by 16%, more than the drop in sales) with all employees contributing to the productivity gains through temporary layoffs, furloughs or reduction of wages (-10% to -20%);
- In Asia-Pacific, gross margin stood at 17.5% of sales, a deterioration of 69bps year-on-year mainly due to country mix (strong growth in China) and negative product mix (PV, Lighting) in the Pacific. Opex (including depreciation) deteriorated by 20bps at 16.7% of sales with salary increase frozen in Asia and “absence no pay” policy implemented in the Pacific;
- At corporate level, opex amounted to €9.5 million [USD $11.14 million], below last year’s level of €12.9 million [USD $15.13 million], as a result of partial unemployment and lower projects at HQ level.
As a result, adjusted EBITA stood at €199.3m [USD $233.78m], down 36.6%, in the first half 2020.
Adjusted EBITA margin was down 136bps at 3.3% of sales, reflecting:
- a drop in adjusted EBITA margin in Europe at 4.0% of sales, down 193bps;
- a lower adjusted EBITA margin in North America at 3.2% of sales, down 73 bps and
- a lower adjusted EBITA margin in Asia-Pacific down 89bps, at 0.8% of sales.
In H1 20, reported EBITA stood at €192.3 million [USD $225.57 million] (including a negative one-off copper effect of €6.9m) [USD $8.09m], down 39.9% year-on-year.
NET INCOME
Net income (loss) of €(439.8)m [USD ($515.89)m] in H1 2020
Recurring net income down 50.7% to €82.5 million (USD $96.77 million) in H1 2020
Operating income (loss) in the first half stood at €(296.8) million [USD (348.15) million] vs. €290.2 million3 (USD $340.40 million) in H1 2019.
- Amortization of intangible assets resulting from purchase price allocation amounted to €6.6 million [USD $7.74 million] (vs. €7.1 million [USD $8.33 million] in H1 2019)
- Other income and expenses amounted to a net charge of €482.5 million [USD $565.96 million] (vs. a net charge of €22.8 million3 [USD $26.74 million] in H1 2019). They included:
- a charge of €486.0 million [USD $570.08 million] from goodwill impairment, mainly reflecting lower volume related to Covid-19 crisis and higher Wacc (increased risk premium in the Covid-19 environment). This impairment concerns various countries including the UK (€162m)[USD $190.03m], US (€108m)[USD $126.68m], Canada (€75m)[USD $87.98m], Germany (€75m)[USD $87.98m], Australia (€41m)[USD $48.09m] and Norway (€18m)[USD $21.11m] carrying historical high level of goodwill from the LBO step-up in 2005 and Hagemeyer acquisition in 2008.
- €1.9 million [USD $2.23 million] of restructuring costs (vs. €13.5 million [USD $15.84 million] in H1 2019)
- €6.0 million [USD $7.04 million] gain on disposals of Gexpro Services and Spanish export business.
Net financial expenses in the first half amounted to €63.1 million [USD $74.02 million] (vs. €94.3 million3 [USD $110.61 million] in H1 2019).
Excluding a €20.8m [USD $24.40m] one-off expense recognized in the first half of 2019 related to the cost of the early repayment of the €650 million [USD $762.45 million] senior notes due 2023, net financial expenses were down €10.4m [USD $12.20m], thanks to lower effective interest rate at 2.43% in H1 2020 (vs. 2.82% in H1 2019).
Net financial expenses include a charge of €22.1m [USD $25.92m] of interest on lease liabilities in H1 2020 (vs €22.5m3 [USD $26.39m] in H1 2019).
Income tax in the first half represented a charge of €79.9 million [USD $93.72 million] in H1 2020 (vs. €32.6 million [USD $38.24] in H1), mainly due to a €(33.8)m [USD $(39.65)m] deferred tax asset depreciation recognized mainly in UK and Germany. H1 2019 included a release of a €29.5 million [USD $34.60 million] reserve on disputed interest expenses tax deductibility following the decision of the Appeal Court favorable for Rexel.
Net income in the first half was negative at -€439.8 million [USD $515.89 million] (vs. a positive €163.3 million3 [USD $191.55 million] in H1 2019).
Recurring net income in the first half amounted to €82.5 million [USD $96.77 million], down 50.7% compared to H1 2019.
FINANCIAL STRUCTURE
Inflow of free cash-flow before interest and tax of €176.8 million [USD $207.39 million] in first half 2020
Indebtedness ratio of 2.59x at June 30, 2020
In the first half, free cash flow before interest and tax was an inflow of €176.8 million [USD $207.39 million] (vs. an outflow of €17.3 million [USD $20.29 million] in H1 2019), representing a Free Cash flow conversion rate (EBITDAaL into FCF before interest and taxes) of 77.7%. This net inflow included:
- An inflow of €17.8 million [USD $20.88 million] from change in working capital (compared to an outflow of €271.1 million3 [USD $318 million] in H1 2019), mainly from active management of working capital;
- Lower cash outflow from restructuring (€7.3m [USD $8.56m] in Germany, Spain & US vs. €28.7m [USD $33.67m] in H1 2019)
- A stable level of capital expenditure (€53.1 million [USD 62.29 million] vs. €53.5 million [USD $62.76 million] in H1 2019). Gross capital expenditure stood at €53.4 million [USD $62.64 million] in H1 2020 compared to €55.9m [USD $65.57m] in H1 2019, with a reduction in capex in Q2 20 (-€9m) [USD -$10.56m] following a strong start with Q1 20 up +€6m [USD $7.04m].
At June 30, 2020, net debt stood at €1,690.3 million [USD $1,982.72 million], down 22.2% year-on-year (vs. €2,172.6 million [USD $2,548.46 million] at June 30, 2019). This represents the lowest level of financial net debt since 2008.
It took into account:
- €35.3 million [USD $41.41 million] of net interest paid in H1 2020 (vs €44.4 million [USD $52.08 million] paid in H1 2019)
- €24.9 million [USD $29.21 million] of income tax paid in the first half compared to €62.5 million [USD $73.31 million] paid in H1 2019, mainly from lower taxable income
- €148.1 million [USD $173.72 million] of proceeds from the disposal of Gexpro Services and the Spanish export business
- €4.9 million [USD $5.75 million] of negative currency effects during the first half (vs a negative effect of €8.4 million [USD $9.85 million] in H1 2019).
At June 30, 2020, the indebtedness ratio (Net financial debt/ EBITDAaL), as calculated under the Senior Credit Agreement terms, stood at 2.59x, lower than the June 30, 2019 level of 2.86x.
PRIORITIES FOR THE COMING QUARTERS
All investments made in the past three years in people, inventories, branch openings, IT and digital have proven their relevance and contributed to transform Rexel into a much more robust company, able to navigate the current turmoil without compromising its medium-term ambition.
The current environment remains volatile and visibility on H2 20 and 2021 is low, notably considering the increasing risk of a second wave of the Covid-19 pandemic in several countries. The uncertainty, both on the shape of the recovery and its timing, leads us to continue withholding full-year guidance.
Rexel has demonstrated its ability to adapt its organization to very different situations from country to country, leveraging its investments over the past three years. Rexel will keep focusing on its fundamentals in order to preserve profitability and FCF generation.
In that context, while Rexel will manage its business with internal KPIs and objectives on a six-month basis, the Group will reaccelerate its medium-term digital transformation roadmap and leverage its digital tools to reinforce its multichannel approach and customer service.
The full earnings report can be downloaded here.
Tagged with Biggest News, financial results, Rexel