


Rueil-Malmaison (France) – Schneider Electric has announced its fourth quarter revenues and full year results for the period ending December 31, 2014. (Click on tables below for a larger view.)

Jean-Pascal Tricoire, Chairman and CEO, commented: “We achieve our targets while facing a turbulent environment in 2014. Our revenues grow 7%, 1.4 % organically and margin expands by 0.4pt at constant FX, on current scope. While early cycle businesses drive revenues up, IT returns to growth and Infrastructure shows signs of improvement at the end of the year. Our balanced geographic footprint also proves to be a key strength as new economies and mature countries supplement each other’s growth over the year.
Invensys integration is well on track. Invensys revenues are up 2% organically. Adjusted EBITA margin expands by 5.5 pts reaching 14.8% and cash generation is strong. All this contributes to double digit EPS accretion for the Group. Invensys confirms its complementarities and synergies with our Industry business thanks to the integration of automation and power, the development of hybrid solutions, and the construction of a strong industrial software portfolio.
2014 marks the end of our “Connect” company program which is another step in building a cohesive, resilient and efficient Schneider Electric. We achieve strong service growth and deliver high supply chain efficiency. Additionally, we strengthen our technology portfolio and enhance capabilities in software, targeted segments and key geographies.
For 2015, we see continued growth in North America, signs of stabilization in Western Europe and a mixed picture in new economies. In this context, the Group targets low single digit organic growth revenues and an adjusted EBITA margin in the range of 14% to 14.5%, assuming no negative currency impact on margin.”
—–
I. FOURTH QUARTER REVENUES WERE UP +2.5% ORGANICALLY
Fourth quarter 2014 revenues were €6,954 million, up +2.5% on an organic basis and +12.5% on a reported basis.

Buildings & Partner (41% of Q4 revenues) was up +2.7% organically. North America achieved good growth, benefiting from dynamic construction and data center markets in the U.S. and some recovery in Mexico. Western Europe was slightly up, driven by focused execution in France and Germany. Asia-Pacific was flat with mixed trends. China was down reflecting continued weakness in construction market, while Australia and India grew. Rest of the World was solid, driven by Africa, Middle East and Russia.
Industry (21% of Q4 revenues) was up +1.8% organically in the quarter, growing at a slower pace compared to the previous quarter, due to the slowdown in China and a high base of comparison. Rest of Asia-Pacific was up, driven by South-East Asia, Australia and Japan. Western Europe was slightly down due to weak French market, while demand from export-oriented OEMs continued to be active in Germany, Spain and Italy. North America experienced lower growth compared to last quarter. While U.S. OEM market remained robust, investment in unconventional oil & gas slowed down in the region. Rest of the World was strong, benefiting from OEM demand and project execution. Services were strong across the board.
Infrastructure (24% of Q4 revenues), was up +0.3% organically in the fourth quarter. Performance was mainly penalized by continued weak utility market in Western Europe. Asia-Pacific was flat as the slowdown in China and South-East Asia was offset by growth in India. North America performed well driven by growth in the US in data centers and services. Rest of the World was flat as growth in Russia and Middle East was dragged down by decline in South America. Services continued to perform strongly in the quarter.
IT (14% of Q4 revenues), was up +6.5% organically in the fourth quarter. North America performed well thanks to good growth in products business and mid-sized datacenters investments. Large and extra-large data centers market remained active, benefiting IT and other businesses. Western Europe posted good growth, driven by continued IT investments in datacenter systems and services. Asia-Pacific was down as China faced a high base of comparison. Rest of the World was up driven by growth in the Middle East. Services continued to grow well in the quarter.
In the fourth quarter, Solutions business was up +5% organically while services were up +8% organically. Solutions represented 47% of 2014 Q4 revenues.

Western Europe (26% of Q4 revenues), was down -1% year-on-year as the weak utility market remained a drag. France was positive due to solid execution in construction and IT projects while the industrial market remained weak. Italy grew thanks to an active OEM market and execution of projects for oil & gas contractors and datacenters. Germany declined due to the continued weakness in the utility market and performance in the Nordics was penalized by a high basis of comparison.
Asia-Pacific (28% of Q4 revenues) was down -1% organically due to the decline in China and South-East Asia. China slowed down due to continued weakness in construction and OEM markets. South-East Asia was impacted by postponement in infrastructure investments. Australia grew thanks to improved residential market and oil & gas project execution. India was up reflecting improved business confidence.
North America (26% of Q4 revenues), grew strongly, up +8% organically reflecting the Group’s growth in construction, data center and industry market in the US. Canada was positive driven by good execution of oil & gas projects. Mexico turned positive owing to signs of market recovery.
Rest of the World (20% of Q4 revenues) performed well, up +5% organically in the quarter. Middle-East experienced good growth due to infrastructure investments in the Gulf and positive environment in Turkey. Russia grew, driven by project execution and customer inventory build-up in anticipation of further currency depreciation. South America declined due to weakness in Brazil.
Revenues in new economies were up 2% organically and represented 45% of total fourth quarter 2014 revenues.
Consolidation and foreign exchange impacts
Net acquisitions contributed €474 million or +7.7% of growth compared to Q4 2013, mainly reflecting the acquisition of Invensys.
The impact of currency fluctuations was positive at €143 million or +2.3%, as the positive effect of the stronger US dollar and Chinese Yuan compared to the Euro, more than offset the negative impact due to depreciation of the Russian Ruble.
—–
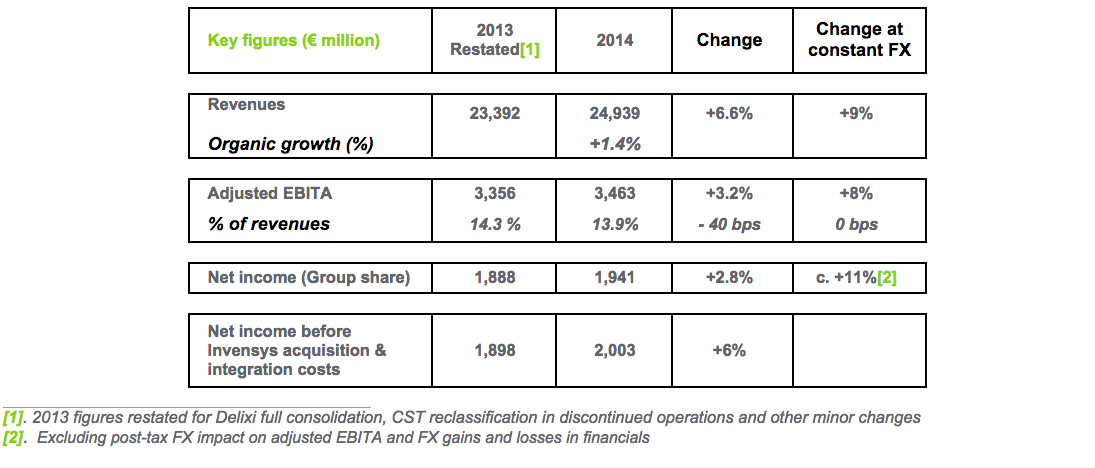
II. FULL YEAR 2014 KEY RESULTS

ADJUSTED EBITA MARGIN AT 13.9%, UP 0.4 POINT AT CONSTANT FX VERSUS 2013 PROFORMA, THANKS TO STRONG PRODUCTIVITY AND CONTRIBUTION OF INVENSYS
Gross profit was up +1.7% organically, mainly driven by productivity and positive net¹ pricing despite a low growth environment.
2014 Adjusted EBITA was €3,463 million, representing 13.9% of revenues.
The key drivers contributing to the earnings change were the following:
- Volume impact was positive €105 million for the full year.
- Consistent strong execution of tailored supply chain initiatives contributed €356 million in 2014, thereby helping the Group achieve €1 billion of industrial productivity during the “Connect” company program.
- The net price impact was positive at €27 million, as the favorable raw materials environment with a tailwind of €72 million compensated for the negative €45 million impact coming for price.
- Production, labor & other costs increased by €67 million. Support function costs had a negative impact of €129 million in 2014 as the Group continued investment in services, R&D and geographic coverage.
- Currency had a €166 million negative impact on the adjusted EBITA. Most of the impact was in H1 2014, as a result of the carry-over from last year’s depreciation of currencies from some new economies against the euro. The FX-impact on adjusted EBITA in H2 was limited.
- Acquisitions, net of divestments, contributed €255 million for the full year, mainly reflecting the consolidation of Invensys.
- Mix was negative at €215 million due to fast growth of mid-market offers, negative geographic mix, notably due to decline in Western Europe and impact of solution growth in H2.
By business, adjusted EBITA of Buildings & Partner 2014 amounted to €1,913 million, or 17.8% of revenues, slightly down -0.8 point year-on-year mainly due to negative FX. In addition the margin was impacted by unfavorable mix due to mid-market offers and investment in new initiatives. Industrygenerated an adjusted EBITA of €1,023 million, or 18.4% of revenues. This reflects an improvement at constant scope of c. +0.7 point driven by positive pricing and operational leverage. Industry adjusted EBITA margin was -0.8 point driven by the “mechanical” dilution coming from the Invensys acquisition. Infrastructure adjusted EBITA was €454million, or 8.6% of revenues, down -1.2 points impacted by low volume and negative mix. ITbusiness reported an adjusted EBITA of €630 million, 18.8% of revenues, stable at -0.1 point compared to 2013, showing resilience in a low growth environment.
Corporate costs in 2014 amounted to €557 million or 2.2% of revenues, at the same level as in the previous year.
Reported EBITA was €3,155 million, after accounting for €202 million of restructuring costs, in line with expectation. A negative impact of €106 millionof other operating income and expenses was mainly driven by the integration costs for Invensys.
NET INCOME BEFORE INVENSYS INTEGRATION COSTS UP +6%
The amortization and depreciation of intangibles was €259 million, compared to €215 million last year, an increase mainly driven by the Invensys acquisition.
Net financial expenses were down -3.5% year-on-year at €467 million with a decreased cost of debt despite an increase in gross debt.
Income tax amounted to €551 million corresponding to an effective tax rate of 22.7% compared to 25.5% last year. As expected, Invensys had a positive contribution in the decrease of the effective tax rate in 2014.
The net income was €1,941 million in 2014, up +3% and +11% at constant FX. Net income before Invensys acquisition & integration costs (post-taxes) was up +6% in 2014.
FREE CASH FLOW OF €1.7BN, 96% CASH CONVERSION²
Free cash flow was reported at €1,704 million. It included net capital expenditure of €829 million, representing 3.3% of revenues, stable excluding the phasing of U.S. office investments in 2014 and one-off building disposal gain in 2013. The trade working capital increased by €162 million. The good performance in inventory was offset by the decrease of accounts payables, on a high comparison base in 2013. Excluding Invensys integration costs, free cash flow was c. €1,774 million. Cash conversion remained high at 96%.
SOLID BALANCE SHEET, INVENSYS ACQUISITION MAIN DRIVER FOR INCREASED NET DEBT
Schneider Electric’s net debt amounted to €5,022 million (€3,326 million in December 2013). The increase was primarily the result of €1,205 million of dividend payment and €1,743 million of net acquisitions (including effects of discontinued operations sold in 2014).
ROCE IMPROVEMENT DESPITE NEGATIVE FX IMPACT
ROCE improved by 80 bps adjusted for negative FX impact in 2014, to 11.7%, and by 10 bps to 11.0% compared to the 2013 proforma level of 10.9%. Invensys contributed double-digit thanks to strong margin improvement and tax benefits.
—–
III. PROPOSED DIVIDEND UP 3% AT 1.92 EURO
At the Annual Meeting on April 21, 2015, shareholders will be asked to approve a dividend of €1.92 per share, up 3% compared to previous year. The proposed dividend will be paid fully in cash on May 5th 2015.
—–
IV. INVENSYS INTEGRATION
Invensys had a strong performance in 2014 with orders at €1,683 million, flat excluding unusual large orders. Revenues were up +2% organically at€1,713 million driven by growth in systems and software and regionally by North America and Asia-Pacific. Adjusted EBITA margin was up 5.5 pointsto 14.8% in 2014 driven by gross margin improvement and cost synergies, despite SFC investments to support long term growth. Free cash-flow was strong at c. €140 million for the year. Invensys contributed double digit EPS accretion in 2014 notably thanks to its strong profitability improvement. Invensys is accretive to the Group adjusted EBITA margin in 2014 and contributes to the lower effective tax rate for the Group.
Invensys generated c. €75 million of cost savings³ by the end of 2014. The Group confirms its objective of €140 million cost savings and targets about 75% by the end of 2015 and 100% by the end of 2016. The tax synergies coming from the acquisition are fully confirmed: €500 million tax synergies, of which more than €300 million realized by 2016, contributing to 3 to 4 pts reduction in effective tax-rate from 2014 to 2016. The Group confirms total integration costs of €150 million by the end of 2015, out of which €81 million were incurred in 2014.
—–
V. CONNECT UPDATE (2012-2014)
The Group executed well and achieved most of the “Connect” targets by the end of 2014.
- Service organic growth rate was strong as Services outgrew the rest of the Group by 7 points per annum on average.
- Solutions adjusted EBITA margin in 2014 was up 1 point compared to the margin in 2011. The 2014 margin was stable compared to 2013 despite the negative impact of FX and volume drop.
- Industrial productivity gains were €1 billion cumulatively, thanks to the success of tailored supply chain initiatives.
- The support function cost to revenues ratio before Invensys was stable compared to 2011, as the Group continued to focus on optimizing R&D, maximizing commercial and back office efficiency, while investing in targeted growth areas.
- Inventory efficiency improved as the inventory to revenues ratio was reduced by c. 2 points since 2011 excluding Invensys.
—–
VI. SHARE BUY BACK
In line with the plan to neutralize the increase in share count due to management and employee share plans, the Group has repurchased 5,989,578 shares for a total amount of c. €371 million in 2014. As of 31st December 2014, the total number of shares outstanding was 584,691,142.
—–
VII. 2015 TARGETS
The Group expects North America to continue to grow, while Western Europe could show signs of stabilization. New economies will show a mixed picture: India should accelerate while Russia will face a difficult environment. China is expected to have a soft start of the year and should gradually improve during the year. Invensys is expected to continue to contribute to the Group performance. Group performance in Q1 will be impacted by a high base of comparison notably in China and for Invensys which may result in like-for-like decline in revenues in the quarter.
In this context, the Group targets for 2015:
- Low single-digit organic growth in revenues
- Adjusted EBITA margin at 14-14.5% assuming no negative FX impact on margin
- An expected significantly positive FX impact, estimated based on current rate at c.€1.5bn on revenues with no material impact on the adjusted EBITA margin.
*******************
The financial statements of the period ending December 31, 2014 were established by Board of directors on February 18, 2015 and certified by the Group auditors on February 18, 2015.
The full year 2014 consolidated financial statements and the interim result presentation are available at www.schneider-electric.com.
First quarter 2015 revenues will be released on April 21, 2015.
_________________________________________________________
¹ Price less raw material impact
² Based on net income excluding discontinued operations
³ Including savings from Patriot plan announced by Invensys in 2013
—–


Tagged with tED