


![]() MILWAUKEE — Rockwell Automation, Inc. today reported fiscal 2021 fourth quarter and full year results and introduced fiscal 2022 guidance.
MILWAUKEE — Rockwell Automation, Inc. today reported fiscal 2021 fourth quarter and full year results and introduced fiscal 2022 guidance.
“We made great strides in the quarter on a number of fronts, despite the continuing effects of COVID and supply chain shortages. Record orders were broad based across all industries and businesses, and continued strategic investments including the Plex acquisition position us very well for the future,” said Blake Moret, Chairman and CEO.
Fiscal 2021 Q4 Financial Results
Fiscal 2021 fourth quarter sales were $1,807.8 million, up 15.1% compared to $1,570.0 million in the fourth quarter of fiscal 2020. Organic sales increased 12.6%, currency translation increased sales by 1.5%, and acquisitions increased sales by 1.0%.
Fiscal 2021 fourth quarter net income attributable to Rockwell Automation was $78.5 million or $0.67 per share, compared to $262.7 million or $2.25 per share in the fourth quarter of fiscal 2020. The decreases in net income attributable to Rockwell Automation and EPS were primarily due to fair-value adjustments recognized in the fourth quarter of fiscal 2021 and fiscal 2020 in connection with our investment in PTC (the “PTC adjustments”). Fiscal 2021 fourth quarter Adjusted EPS was $2.33, up 20.7% compared to $1.93 in the fourth quarter of fiscal 2020, primarily due to higher sales and a lower tax rate.
Pre-tax margin was 0.2% in the fourth quarter of fiscal 2021, compared to 19.1% in the same period last year. The decrease in pre-tax margin was primarily due to the PTC adjustments.
Total segment operating margin was 17.9% in the fourth quarter compared to 20.2% a year ago. The decrease in segment operating margin was primarily due to higher planned spend, the reinstatement of incentive compensation, and the reversal of temporary pay actions, partially offset by higher sales. Total segment operating earnings were $323.2 million in the fourth quarter of fiscal 2021, flat compared to $317.9 million in the same period of fiscal 2020.
Cash flow provided by operating activities in the fourth quarter of fiscal 2021 was $204.1 million, compared to $325.8 million in the fourth quarter of fiscal 2020. Free cash flow was $160.4 million compared to $303.8 million in the fourth quarter of fiscal 2020, primarily due to higher working capital.
Fiscal 2021 Full Year Financial Results
Sales were $6,997.4 million in fiscal 2021, up 10.5% from $6,329.8 million in fiscal 2020. Organic sales increased 6.7%, currency translation increased sales by 2.3%, and acquisitions increased sales by 1.5%.
Fiscal 2021 net income attributable to Rockwell Automation was $1,358.1 million or $11.58 per share, compared to $1,023.4 million or $8.77 per share in fiscal 2020. The increases in net income attributable to Rockwell Automation and EPS were primarily due to higher sales and the PTC adjustments. Fiscal 2021 Adjusted EPS was $9.43, up 19.8% compared to $7.87 in fiscal 2020. The increase in Adjusted EPS was primarily due to higher sales, partially offset by the reinstatement of incentive compensation and the reversal of temporary pay actions.
Pre-tax margin was 21.8% in fiscal 2021, compared to 17.9% last year. The increase in pre-tax margin was primarily due to the PTC adjustments.
Total segment operating margin was 19.9% compared to 19.9% a year ago. Total segment operating earnings were $1,391.3 million in fiscal 2021, up 10.6% from $1,257.9 million in fiscal 2020, primarily due to higher sales.
Cash flow provided by operating activities in fiscal year 2021 was $1,261.0 million, compared to $1,120.5 million in fiscal 2020. Free cash flow was $1,140.7 million compared to $1,006.6 million last year.
Outlook
The table below provides guidance for sales growth and earnings per share for fiscal 2022. Our guidance reflects strong demand as well as record backlog entering into fiscal year 2022. Supply chain challenges remain dynamic, and our projections assume gradual improvement over the course of the year.
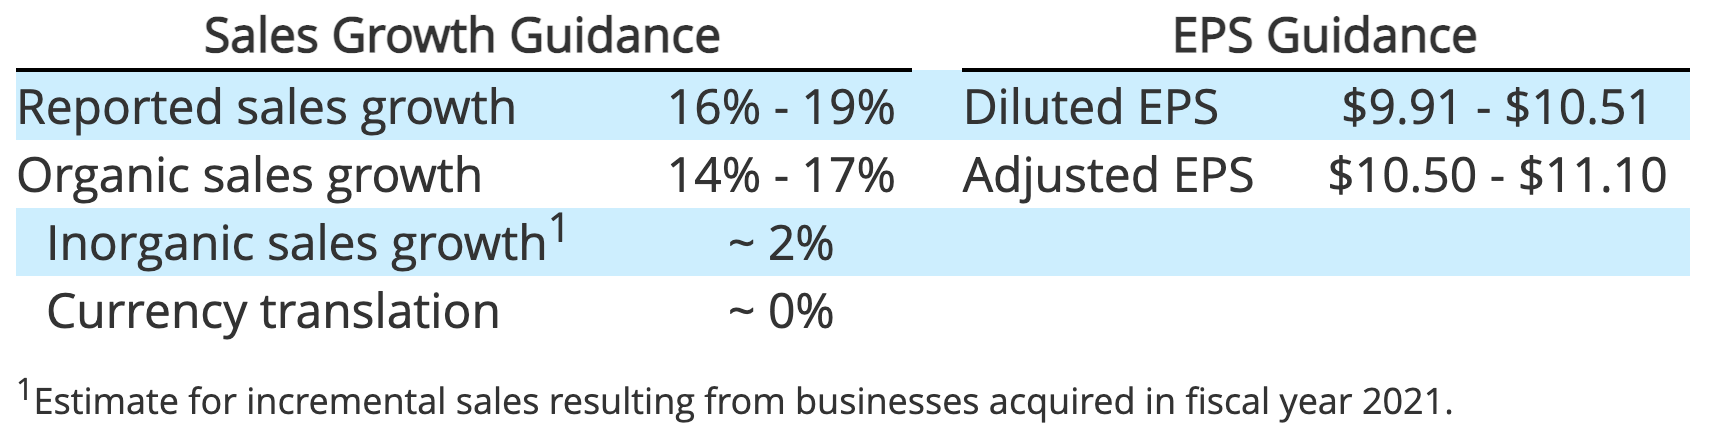
“2022 will be a breakout year for Rockwell, with sales expected to exceed $8B as component supply improves. Major new product introductions and recent acquisitions will fuel continued orders growth globally across all industry segments. I’m excited to see our great people bring our strategy to life,” Moret continued.
Following is a discussion of fourth quarter and full year results for our business segments.
Intelligent Devices
Intelligent Devices fiscal 2021 fourth quarter sales were $857.1 million, an increase of 16.7% compared to $734.5 million in the same period last year. Organic sales increased 15.2% and currency translation increased sales by 1.5%. Segment operating earnings were $166.3 million in the fourth quarter of fiscal 2021 compared to $134.9 million in the same period last year. Segment operating margin increased to 19.4% in the fourth quarter of fiscal 2021 from 18.4% a year ago.
Intelligent Devices fiscal 2021 sales were $3,311.9 million, an increase of 12.0% from $2,956.0 million last year. Organic sales increased 9.7% and currency translation increased sales by 2.3%. Segment operating earnings were $702.1 million in fiscal 2021 compared to $587.8 million in fiscal 2020. Segment operating margin increased to 21.2% in fiscal 2021 from 19.9% a year ago, primarily due to higher sales.
Software & Control
Software & Control fiscal 2021 fourth quarter sales were $494.1 million, an increase of 18.8% compared to $415.9 million in the same period last year. Organic sales increased 13.6%, currency translation increased sales by 1.5%, and inorganic investments increased sales by 3.7%. Segment operating earnings were $119.8 million in the fourth quarter of fiscal 2021 compared to $114.5 million in the same period last year. Segment operating margin decreased to 24.2% in the fourth quarter of fiscal 2021 from 27.5% a year ago, primarily related to higher planned investment spend, partially offset by higher sales.
Software & Control fiscal 2021 sales were $1,947.0 million, an increase of 15.8% from $1,681.3 million last year. Organic sales increased 10.0%, currency translation increased sales by 2.5%, and inorganic investments increased sales by 3.3%. Segment operating earnings were $531.0 million in fiscal 2021 compared to $473.8 million in fiscal 2020. Segment operating margin decreased to 27.3% in fiscal 2021 from 28.2% a year ago, primarily due to higher planned investment spend and the reinstatement of incentive compensation, partially offset by higher sales.
Lifecycle Services
Lifecycle Services fiscal 2021 fourth quarter sales were $456.6 million, an increase of 8.8% compared to $419.6 million in the same period last year. Organic sales increased 7.0%, currency translation increased sales by 1.7%, and inorganic investments increased sales by 0.1%. Segment operating earnings were $37.1 million in the fourth quarter of fiscal 2021 compared to $68.5 million in the same period last year. Segment operating margin decreased to 8.1% in the fourth quarter of fiscal 2021 from 16.3% a year ago, primarily related to the reversal of temporary pay reductions, the reinstatement of incentive compensation, and unfavorable project mix, partially offset by higher sales.
Lifecycle Services fiscal 2021 sales were $1,738.5 million, an increase of 2.7% from $1,692.5 million last year. Organic sales decreased 1.8%, currency translation increased sales by 2.2%, and inorganic investments increased sales by 2.3%. Segment operating earnings were $158.2 million in fiscal 2021 compared to $196.3 million in fiscal 2020. Segment operating margin decreased to 9.1% in fiscal 2021 from 11.6% a year ago, primarily due to the reinstatement of incentive compensation.
Supplemental Information
Corporate & Other – Fiscal 2021 fourth quarter corporate and other expense was $33.0 million compared to $22.0 million in the fourth quarter of 2020. Corporate and other expense was $120.6 million for the full fiscal year 2021 compared to $98.9 million in fiscal 2020. The increase is driven by deal costs associated with the acquisition of Plex Systems.
Purchase Accounting Depreciation and Amortization – Fiscal 2021 fourth quarter purchase accounting depreciation and amortization expense was $17.4 million, up $6.1 million from the fourth quarter of fiscal 2020. Full year fiscal 2021 purchase accounting depreciation and amortization expense was $55.1 million, up $13.7 million from fiscal 2020.
Tax – On a GAAP basis, the effective tax rate in the fourth quarter of fiscal 2021 was (1,634.9)% compared to 12.0% in the fourth quarter of 2020. The Adjusted Effective Tax Rate for the fourth quarter of fiscal 2021 was (3.1)% compared to 15.2% in the fourth quarter of 2020. These decreases were related to the cumulative impact of several one-time discrete items recognized in the current quarter. The effective tax rate for the full fiscal year 2021 was 11.9% compared to 9.9% in fiscal 2020. The Adjusted Effective Tax Rate for the full fiscal year 2021 was 11.6% compared to 12.4% in fiscal 2020.
Share Repurchases – The Company repurchased 0.2 million shares of its common stock at a cost of $61.2 million during the fourth quarter of fiscal 2021. For the full fiscal year 2021, the Company repurchased 1.1 million shares of its common stock at a cost of $301.4 million. At September 30, 2021, $552.3 million remained available under our existing share repurchase authorizations.
ROIC – Return on invested capital was 30.7%.
Non-GAAP Measures – Organic sales, total segment operating earnings, total segment operating margin, Adjusted Income, Adjusted EPS, Adjusted Effective Tax Rate, free cash flow, free cash flow conversion, and return on invested capital are non-GAAP measures that are reconciled to GAAP measures in the attachments to this release.
Organic ARR – Annual recurring revenue (ARR) is a key metric that enables measurement of progress in growing our recurring revenue business. It represents the annual contract value of all active recurring revenue contracts at any point in time. Recurring revenue is defined as a revenue stream that is contractual, typically for a period of 12 months or more, and has a high probability of renewal. The probability of renewal is based on management’s best estimate about the underlying contract. Organic ARR growth is calculated as the dollar change in ARR, adjusted to exclude the effects of currency translation and acquisitions, divided by ARR as of the prior period. The effects of currency translation are excluded by calculating Organic ARR on a constant currency basis. When we acquire businesses, we exclude the effect of ARR in current period for which there was no comparable ARR in the prior period. Organic ARR growth is also used as a financial measure of performance for our annual incentive compensation. Because ARR is based on annual contract value, it does not represent revenue recognized during a particular reporting period or revenue to be recognized in future reporting periods and is not intended to be a substitute for revenue, contract liabilities, or backlog.
Tagged with financial results, Rockwell Automation