






(BLS) The U.S. Bureau of Labor Statistics today released the U.S. Import and Export Price Indexes for March, 2026.
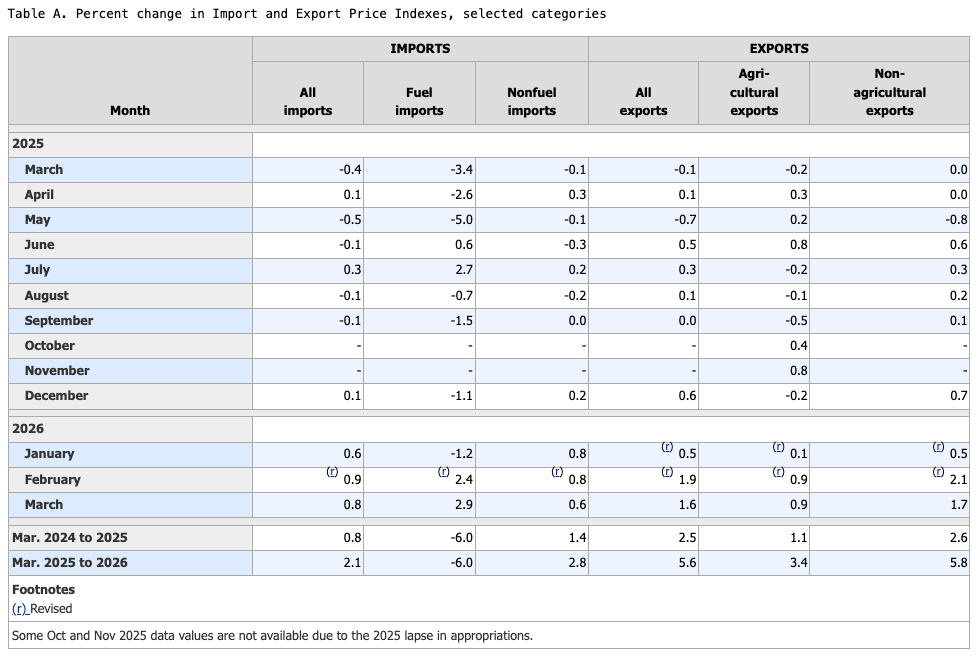
U.S. import prices increased 0.8 percent in March, the U.S. Bureau of Labor Statistics reported today, following a 0.9-percent rise in February. Higher prices for nonfuel imports and fuel imports drove the advance in March. Prices for U.S. exports rose 1.6 percent in March, after increasing 1.9 percent the previous month.
Imports
U.S. import prices rose 0.8 percent in March, following increases of 0.9 percent in February and 0.6 percent in January. Prices for U.S. imports advanced 2.1 percent from March 2025 to March 2026. The 12-month increase in U.S. import prices was the largest over-the-year advance since the index rose 2.2 percent in December 2024. (See All commodities in table 1.)
Fuel Imports: Import prices for fuels and lubricants increased 2.9 percent in March, following an advance of 2.4 percent in February. The March increase was the largest monthly advance since the index rose 3.0 percent in January 2025. Higher prices for petroleum more than offset lower prices for natural gas. In March, prices for import petroleum and petroleum products advanced 9.4 percent. Natural gas import prices declined 71.0 percent in March, after rising 77.3 percent over the prior 3 months. Despite March’s increase, import fuels and lubricants prices decreased 6.0 percent over the past 12 months. The price index for import petroleum and petroleum products declined 4.2 percent from March 2025 to March 2026. Prices for import natural gas fell 49.8 percent over the same period.
All Imports Excluding Fuel: Prices for nonfuel imports advanced 0.6 percent in March, following a rise of 0.8 percent in February. Higher prices for nonfuel industrial supplies and materials; capital goods; consumer goods excluding automotives; and foods, feeds, and beverages drove the increase. Nonfuel import prices advanced 2.8 percent on a 12-month basis. The March increase was the largest over-the-year advance since the index rose 2.9 percent in October 2022. Higher prices for nonfuel industrial supplies and materials, capital goods, and consumer goods excluding automotives more than offset lower prices for foods, feeds, and beverages as well as for automotive vehicles, parts and engines from March 2025 to March 2026.
Foods, Feeds, and Beverages: Import foods, feeds, and beverages prices advanced 0.5 percent in March, following increases of 0.3 percent in February and 0.4 percent in January. Higher prices for vegetables; fruit; fish and shellfish; as well as for cane and beet sugar contributed to the increase in March.
Nonfuel Industrial Supplies and Materials: Import prices for nonfuel industrial supplies and materials increased 1.6 percent in March, after a 2.2-percent advance in February. Higher prices for finished metals shapes and advanced manufacturing and for major nonferrous metals-crude drove the advance.
Finished Goods: Prices for the major finished goods import categories were mostly up in March. Import capital goods prices increased 0.5 percent in March. Higher import prices for computers, peripherals and semiconductors; civilian aircraft, engines, and parts; and industrial and service machinery contributed to the advance. The price index for import consumer goods excluding automotives rose 0.4 percent in March. Higher prices for medicinal, dental and pharmaceutical preparatory materials drove the overall increase in import consumer goods excluding automotives prices. The price index for automotive vehicles, parts and engines recorded no change in March.
Exports
Prices for U.S. exports advanced 1.6 percent in March. Higher prices for nonagricultural exports and agricultural exports drove the increase. U.S. export prices rose 5.6 percent for the 12-month period ended March 2026. The March advance was the largest over-the-year increase since the index rose 6.1 percent in November 2022. (See All commodities in table 2.)
Agricultural Exports: The price index for agricultural exports increased 0.9 percent in March, following a 0.9-percent rise in February. Higher prices for soybeans, fruit, and meat drove the advance in agricultural exports in March. The price index for agricultural exports increased 3.4 percent over the past 12 months, as higher prices for soybeans; other foods and food preparations; and meat more than offset lower prices for corn.
All Exports Excluding Agriculture: Export prices for nonagricultural commodities increased 1.7 percent in March, after rising 2.1 percent in February. Higher prices for nonagricultural industrial supplies and materials more than offset lower prices for capital goods and for consumer goods excluding automotives. Nonagricultural commodities export prices advanced 5.8 percent from March 2025 to March 2026. Higher prices for nonagricultural industrial supplies and materials, capital goods, and consumer goods excluding automotives contributed to the 12-month increase.
Nonagricultural Industrial Supplies and Materials: Nonagricultural industrial supplies and materials prices increased 4.3 percent in March, after an advance of 4.9 percent the previous month. Higher export prices for crude petroleum, other petroleum products, and fuel oil more than offset lower export prices for natural gas and for nonmonetary gold.
Finished Goods: Prices for the major finished goods export categories were mostly down in March. Capital goods prices decreased 0.2 percent in March. Lower prices for semiconductors and for other industrial machinery more than offset higher prices for computers. In March, export prices for consumer goods excluding automotives declined 0.2 percent, the first monthly decrease for the price index since September 2025. The price index for automotive vehicles, parts and engines recorded no change in March.
More information for the major import and export price indexes can be found at www.bls.gov/web/ximpim/largest.htm.
Measures of Import and Export Prices by Locality
Imports by Locality of Origin: Import prices from China increased 0.7 percent in March, the largest monthly advance since December 2021. Despite the monthly rise, the price index for imports from China declined 1.1 percent over the past 12 months. Prices for imports from Japan decreased 0.2 percent in March, following an increase of 0.2 percent in February. The price index for imports from Japan advanced 0.4 percent from March 2025 to March 2026. Import prices from the European Union and Mexico rose 0.3 percent and 0.8 percent, respectively, in March. In contrast, prices for imports from Canada edged down 0.1 percent over the same period. (See table 7.)
Exports by Locality of Destination: Prices for exports to China increased 2.3 percent in March, following a decline of 0.4 percent in February. The March advance was the largest monthly increase since the index rose 2.4 percent in October 2024. The price index for exports to China increased 3.6 percent over the past 12 months. Prices for exports to Japan decreased 0.5 percent in March, following advances of 2.4 percent in February and 1.4 percent in January. The price index for exports to Japan rose 5.6 percent from March 2025 to March 2026. Export prices to the European Union advanced 2.6 percent in March and the price index for exports to Canada increased 0.8 percent over the same period. Prices for exports to Mexico advanced 3.2 percent in March, the largest monthly increase since a 4.7-percent rise in May 2022. (See table 8.)
Terms of Trade Indexes: Terms of trade indexes are based on country, region, or grouping and measure the change in the purchasing power of exports relative to imports. The U.S. terms of trade index with China increased 1.6 percent in March, following a 0.6-percent decrease in February. The index for U.S. terms of trade with Japan declined 0.3 percent in March, after increasing 2.3 percent the previous month. The U.S. terms of trade index with the European Union increased 2.3 percent in March, after rising 2.4 percent in February. In March, the U.S. terms of trade index with Canada increased 0.8 percent and the index for U.S. terms of trade with Mexico advanced 2.4 percent. (See table 9.)
Import and Export Services
Imports: Import air passenger fares advanced 2.0 percent in March, after decreasing 0.4 percent in February. Higher Asian, European, and Latin American/Caribbean fares drove the overall increase in import air passenger fares in March. Import air passenger fares increased 1.3 percent from March 2025 to March 2026. Prices for import air freight fell 2.0 percent in March, following a 2.9-percent decline in February. Lower prices for import Asian air freight more than offset higher prices for import European air freight in March. Despite the monthly decrease, import air freight prices advanced 8.3 percent for the year ended March 2026. (See table 10.)
Exports: Export air passenger fares increased 5.6 percent in March, following an 11.9-percent decrease the previous month. Higher European, Asian, and Latin American/Caribbean fares in March contributed to the overall advance in export air passenger fares. The price index for export air passenger fares advanced 1.3 percent from March 2025 to March 2026, the largest over-the-year increase since the index rose 3.6 percent in January 2025. Export air freight prices recorded no change in March, after advancing 1.6 percent in February. The price index for export air freight declined 2.5 percent over the past year.
Tables:
Table 1 U.S. Import Price Indexes, by End Use
Table 2 U.S. Export Price Indexes, by End Use
Table 3 U.S. Import Price Indexes, by NAICS
Table 4 U.S. Export Price Indexes, by NAICS
Table 5 U.S. Import Price Indexes, by Harmonized System
Table 6 U.S. Export Price Indexes, by Harmonized System
Table 7 U.S. Import Price Indexes, by Locality of Origin
Table 8 U.S. Export Price Indexes, by Locality of Destination
Table 9 U.S. Terms of Trade Indexes, by Locality
Table 10 U.S. International Price Indexes for Selected Transportation Services
Tagged with economy