





 PITTSBURGH — Wesco International announces its results for the second quarter of 2025.
“We continued to build on our positive sales momentum in the first half of 2025 and outperformed the market with our leading portfolio of products, services, and solutions. Sales growth is accelerating, with organic sales up 6% in the first quarter, 7% in the second quarter, and preliminary July sales per workday up approximately 10% year-over-year. The second quarter performance was led by 17% organic growth in CSS and 6% organic growth in EES. Total data center sales eclipsed $1B in the quarter, setting a new mark, and were up 65% versus the prior year. And, on an encouraging note, our Utility business has begun to show signs of improvement as sales to investor-owned utilities returned to growth in the second quarter. Our Wesco opportunity pipeline continues to grow, bid activity levels remain very strong, and backlog is at record levels, increasing both year-over-year and sequentially across all three business segments. Adjusted EBITDA margin was up 90 basis points sequentially as we generated strong operating leverage on higher topline sales and stable gross margin. All in all, we’re off to a good start in the first half of 2025 and we are building on that momentum for the remainder of the year,” said John Engel, Chairman, President, and CEO.
Engel added, “As planned, we completed the redemption of our preferred stock in June improving both our cash flow and earnings per share run rates. Following this redemption, we have no significant debt maturities until 2028 and have strong liquidity to execute our capital allocation priorities. As we outlined in our last Investor Day, over 75% of our free cash flow generation is targeted to debt reduction, stock buybacks and acquisitions.”
Engel concluded, “We are raising our full-year organic sales growth outlook based on our positive momentum through the first seven months of 2025 while maintaining our EPS mid-point. We remain firmly focused on executing our cross-selling initiatives and enterprise-wide margin improvement program while delivering operational improvements enabled by our technology-driven business transformation. As the market leader, the enduring secular trends of AI-driven data centers, increased power generation, electrification, automation, and reshoring underpin my confidence that Wesco will continue to outperform our markets this year.”
Key Financial Highlights
Net Sales
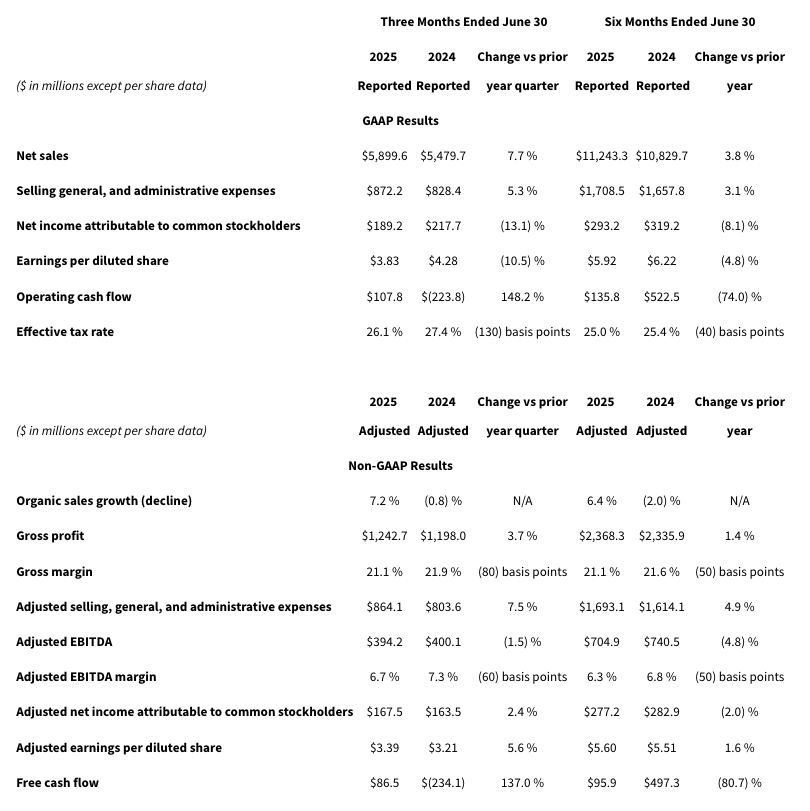
- On an organic basis, which removes the impact of the Ascent, LLC (“Ascent”) acquisition, sales for the second quarter of 2025 grew by 7.2%. The increase in organic sales reflects volume and price growth in the CSS and EES segments, partially offset by a volume decline in the UBS segment. Sequentially, net sales increased 10.4% and organic sales grew by 6.2%. Backlog at the end of the second quarter of 2025 increased by 11% compared to the end of the second quarter of 2024. Sequentially, backlog increased by approximately 5%.
- On an organic basis, which removes the impact of the Wesco Integrated Supply (“WIS”) divestiture and Ascent acquisition, differences in foreign exchange rates, and the impact from the number of workdays, sales for the first six months of 2025 grew by 6.4%. The increase in organic sales reflects volume and price growth in the CSS and EES segments, partially offset by a volume decline in the UBS segment.
Gross Profit and Gross Margin
- The decrease in gross margin for the three and six months ended June 30, 2025 reflects a decrease in all three segments. Lower gross margin was driven by increased project activity and product mix in the EES segment and growth with hyperscale data center customers in the CSS segment, which is inclusive of higher inventory adjustments, partially offset by higher supplier volume rebates. Sequentially, gross margin remained flat.
Selling, General, and Administrative (“SG&A“) Expenses
- The increase in SG&A expenses for the second quarter of 2025 is driven by higher salaries and benefits, increased costs to operate our facilities, an increase in transportation costs, and higher IT costs, partially offset by a decrease in other income and deductions. SG&A expenses for the second quarter of 2025 include $8.1 million of digital transformation and restructuring costs. SG&A expenses for the second quarter of 2024 include a $17.8 million loss on abandonment of assets and $7.0 million of digital transformation and restructuring costs. Adjusted for these costs, SG&A expenses were 14.6% and 14.7% of net sales for the second quarter of 2025 and 2024, respectively, reflecting operating cost leverage on sales growth.
- The increase in SG&A expenses for the first six months of 2025 is driven by higher salaries and benefits, increased costs to operate our facilities, an increase in transportation costs, and higher IT costs, partially offset by a decrease in other income and deductions. SG&A expenses for the first six months of 2025 include $15.4 million of digital transformation and restructuring costs. SG&A expenses for the first six months of 2024 include $21.1 million of digital transformation and restructuring costs, a $17.8 million loss on abandonment of assets, and $4.8 million of excise taxes on excess pension plan assets. Adjusted for these costs, SG&A expenses were 15.1% and 14.9% of net sales for the first six months of 2025 and 2024, respectively.
Adjusted EBITDA and Adjusted EBITDA Margin
- The decrease in Adjusted EBITDA for the second quarter of 2025 primarily reflects lower gross margin due to large project wins, and a $43.8 million increase in SG&A expenses as described above. Sequentially, Adjusted EBITDA margin increased 90 basis points.
- The decrease in Adjusted EBITDA for the first six months of 2025 primarily reflects lower gross margin due to large project wins, and a $50.7 million increase in SG&A expenses as described above.
Effective Tax Rate
- The lower effective tax rate for the second quarter of 2025 is due to a higher provision for income taxes related to uncertain tax positions in the prior year period. The effective tax rate for the first six months of 2025 remained relatively consistent with the first six months of 2024.
Adjusted Earnings Per Diluted Share
- The increase in adjusted earnings per diluted share in the second quarter of 2025 primarily reflects lower adjusted EBITDA and a $10.5 million decrease in adjusted other income primarily due to fluctuations in the U.S. dollar against certain foreign currencies, in which we recognized a net foreign currency exchange gain of $3.0 million for the second quarter of 2025 compared to a net loss of $3.4 million for the second quarter of 2024. Further, there was a $6.0 million decrease in interest expense primarily due to debt refinancing activities and lower interest rates. There was a positive impact from the reduction in outstanding shares during the second quarter of 2025 as compared to the second quarter of 2024.
- The increase in adjusted earnings per diluted share in the first six months of 2025 primarily reflects lower adjusted EBITDA, offset by a $14.0 million decrease in interest expense due to debt refinancing activities and lower interest rates. Further, there was a $26.7 million decrease in adjusted other income primarily due to fluctuations in the U.S. dollar against certain foreign currencies, in which we recognized an immaterial net foreign currency exchange gain for the first six months of 2025 compared to a net loss of $20.7 million for the first six months of 2024. There was a positive impact from the reduction in outstanding shares during the first six months of 2025 as compared to the first six months of 2024.
Operating Cash Flow
- The net operating cash inflow in the second quarter of 2025 was primarily driven by net income of $174.8 million and non-cash adjustments to net income totaling $63.6 million, which primarily comprised depreciation and amortization, stock-based compensation expense, and amortization of debt issuance costs and debt discount. The inflow was partially offset by a net outflow of $187.2 million from changes in net working capital consisting of an increase in trade accounts receivable of $242.5 million primarily due to the timing of receipts from customers and an increase in inventories resulting in a use of cash of $175.7 million, partially offset by an increase in accounts payable resulting in a cash inflow of $230.9 million primarily due to the timing of payments to suppliers as well as inventory purchases. Other sources of cash include $39.1 million from an increase in accrued payroll and benefit costs, primarily comprised of an increase in accrued variable compensation, accrued salaries and wages, and accrued sales incentives.
- The net operating cash inflow for the first six months of 2025 was primarily driven by net income of $293.1 million and non-cash adjustments to net income totaling $130.0 million, which primarily comprised depreciation and amortization, stock-based compensation expense, and amortization of debt issuance costs and debt discount. The inflow was partially offset by a net outflow of $259.6 million from changes in working capital consisting of an increase in trade accounts receivable of $431.2 million primarily due to the timing of receipts from customers and an increase in inventories resulting in a use of cash of $403.1 million, partially offset by an increase in accounts payable resulting in a cash inflow of $574.7 million. Uses of cash in the first six months of 2025 also included a decrease in accrued payroll and benefit costs of $38.0 million primarily due to the payment of management incentive compensation earned in 2024 and a decrease in accrued sales incentives.